Here is a link to an High Country News piece by John Maclean.
The headline is a bit overwrought in my opinion. But perhaps that’s the job of headline writers. In recent phone calls around the country, I’m also hearing about forest fires and homes elsewhere than in the west..
Here are some excerpts:
We need to encourage firefighters to exercise more caution, even when homes are at stake. Let the fires that are riskiest for firefighters burn. And assure the firefighters that the nation will have their backs when the inevitable complaints pour in.
Before I retired, there was a massive effort led by Chief Tidwell called the Safety Journey. Part of it was directed specifically at exactly that.. helping people become comfortable with saying “no” to unsafe conditions. Perhaps these efforts did not work and are not working. But it doesn’t sound like a policy question. The policy is not to endanger yourself.
Later, Maclean says:
Every firefighter like her who just says “No” needs support from the fire community and the public.
That was the point of the Safety Journey. If that’s not happening, I bet someone is studying why not. It would be good to hear from them.
Even with everything we hurl at the flames, Western states keep setting new records for homes lost and acreage burned. The federal government alone, not counting the state governments and other entities, has spent more than $3 billion per year on this war, on average since 2002, according to the Congressional Research Service. The U.S. Forest Service has tilted its budget toward preparedness and suppression, and the president’s 2014 budget calls for a 27 percent increase in the firefighting funding.
Meanwhile, budgets for fuels reduction — fire prevention — are cut, robbing the future to pay for the present. In the 2014 budget, for instance, fuels-reduction programs take a 37 percent hit, down to $201 million. The funding shift also reduces support for campground services, research projects, trail maintenance and other worthy — and popular — endeavors.
The prescribed burning and forest-thinning projects that fit within the budget are often stymied by environmental activists and locals complaining about smoke. Or severe fire risk interferes, as the prescribed-burning season grows ever shorter. Government agencies cannot catch up to the problem: There isn’t enough money or political will.
Even though safety practices have improved, each year between eight and 30 wildland firefighters are killed in the war (download one report here and another here covering a longer period.) It might not sound like a large number, but it takes a terrible toll in the families and the close-knit firefighting community. No one would be surprised if the toll rises. And regardless of the numbers, there’s a principle of homeowners taking responsibility.
It’s great that many homeowners are trying to make their homes more fire-resistant, but we need to tell them, we can no longer commit to saving their homes if their efforts fall short. They chose to live out there, and they — and their insurance companies — must accept the consequences.
I just read this piece in the Denver Post the Black Forest Fire this morning.
“Black Forest fire insurance claims nearing $300 million.” So at least in Colorado, folks are pretty aware of the consequences of fires burning.
At the end, he talks about letting his cabin burn. Once again, a cabin is not a subdivision. It seems like in many of these stories that are in the press, and op-eds, places like the Black Forest or Waldo Canyon are conflated with cabins or parcels deep in the woods.
If you are curious about the firefighter deaths statistics, here’s the paragraph in the report Macclean cites that describes the reasons for the fatalities:
Deaths on the Fire Ground
The breakdown of causes of fatal injuries on the fire ground is shown in Figure C. Thirty firefighters were killed in 20 fire department vehicle crashes during fire suppression activities, including 24 in 16 aircraft crashes. Nineteen of those 24 victims were contractors (mostly pilots) working for state and federal land management agencies. The others were employees of state and federal land management agencies.
Overexertion, stress and related medical issues accounted for the next largest proportion of deaths. Sudden cardiac death accounted for 25 of these 26 fatalities; one firefighter died of heat troke.
The third largest proportion of deaths during fire suppression activities occurred when firefighters were caught or trapped by fire progress (25 deaths). Seventeen of them died as a result of burns; eight died of asphyxiation.
Eleven firefighters were struck by objects — five by a tree or snag, three by vehicles, one by a rock, one by a section of an exploding storage tank and one by a rope that snapped while he was trying to tow a stuck apparatus at a wildfire.
Seven firefighters were electrocuted – five came into contact with downed power lines and two were struck by lightning.
Two firefighters fell from cliffs and two fell from apparatus during fire ground operations.
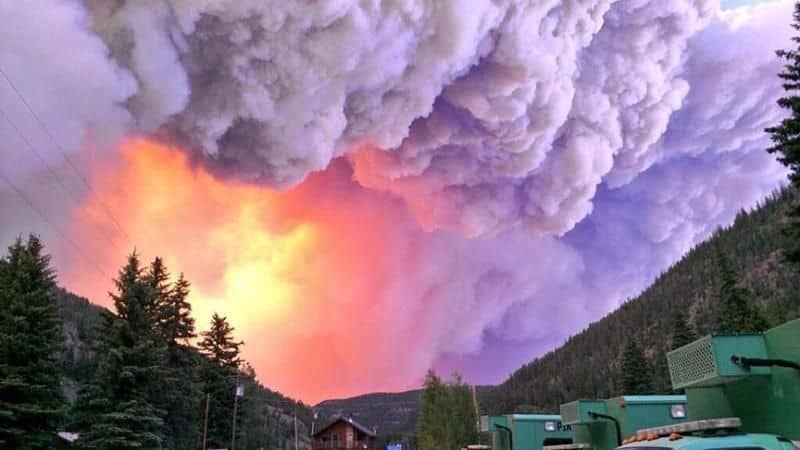
That picture is truly awesome…. and scary! Remember, a bigger fire is much, MUCH more dangerous than a small one. Looking at all the reasons for deaths, it is VERY apparent that more of those things happen when fires are allowed to get so big, in the name of …… “safety”. Most of these fire articles don’t mention the faults of the Let Burn tactics. It will be sooner than later when those tactics lead DIRECTLY to fatalities. I’m sure it has already happened but, if it happens this year, we need to make sure the public knows that POLICY killed those people.
Most burn-over fatalities occur during the transition from “small” to “big” fire. Once the fire is “big,” firefighters have already retreated to indirect attack. It is the seemingly “small” fire that is always the most dangerous.
Look at all of the varied causes! Those things occur during BIG fires. There are much more aircraft used in indirect attack. Vehicle accidents occur more often when there are many days of driving, to and from the BIG fire, with LOTS more fireline to cover. BIG fires last for weeks, instead of days. Finally, if there were no “transition”, that would make your point moot, eh, Andy? Read the whole article!
Read my comment, Larry. I said “burn-over fatalities.” I didn’t mention aircraft, vehicles, heart attacks, or any of the other myriad ways firefighters die. Burn-overs generally happen when fires blow-up. Burn-overs are much less common on fires that have already blown up or never blow up.
Nonetheless, the fact is that all sources of wildfire fatalities are less common on big fires. That’s because “big fires” are uncommon; they make up a very small percent (<1) of total ignitions. With about 98% of ignitions contained to fewer than 300 acres (Forest Service initial attack success rate), there are many more opportunities to die while driving to small fires than big ones. Same with heart attacks. Same with air attack.
Big fires get the big headlines. But, fatalities don't care about headlines. Most of a wildland firefighter's career is spent on the 98% of ignitions that remain small. Except for burn-overs, which are associated with fires that "go big," all other fatality rates are proportional to total firefighter hours, most of which are devoted to small fires.
You can believe that, Andy, but with big fires, when you “roll the dice” so many more times, you’re bound to “crap out” more often, too. Besides, on initial attacks, there are MUCH fewer personnel on it, as well. MORE dice rolls! Fatalities are fatalities, regardless of when or where they happen, they are “fire-related”. It’s a matter of probability. When you can reduce the amount of dice rolls, shouldn’t we be doing just that?!?
Maclean wrote:
However (to my knowledge) the last time the Government Accountability Office looked directly at the issue of litigation and appeals of Forest Service “fuel reduction” projects they found that nationwide, 98% of Forest Service decisions approving hazardous fuels reduction projects were implemented without litigation. That study covered FY 2006 to FY 2008. In addition, during the same time period they found that administrative appeal rates dropped by 69% compared to 2002-2003.
How in the hell can the fact that 98% of Forest Service fuel reduction projects were litigation-free all of a sudden become “often stymied by environmental activists and locals?”
But, hey, as we know, facts and documentation have no place in any debate about wildfires and Forest Service policy. Nope….it’s much better to just repeat rural myths, fear monger and spread misleading rumors, right?
On my last Ranger District, one of the fire crews spent more time playing poker than preparing firelines for controlled burns. When I was on a remote engine in the boonies of Idaho, we worked ourselves out of a job, installing firelines for controlled burns. The public’s distaste for smoke and potential for escapes reduces the amount of burns completed. Western Regions’ burn accomplishments are pitiful but, I wouldn’t blame it on “litigation”. With nearly a MILLION acres of prescribed burns completed in the South, that sure bumps up the “non-litigation” stats! I blame liability and rural public opinion on the lack of prescribed fires, in the West. It IS clear that there is PLENTY of money! The Forest Service just doesn’t want to spend it on anything other than wildfires.
Matthew, you keep bringing up that GAO report.here’s what I said before.
Sharon, According to the actual actual GAO report the US Forest Service Northern Region had 132 total fuel reduction decisions during FY 2006 to FY 2008. Of those 132 total fuel reduction projects 11 were litigated. That comes to about 8%.
8% of all projects being litigated doesn’t mean it happens “often.” For example, if I shot 132 free throws and missed 11 of them, nobody would claim that I “often” miss free throws.
Sure, of the projects “subject to appeal” 36% were appealed. But as we all know the public citizen appeals process is just part of the public process established by the US Congress. Certainly you aren’t upset because US Citizens and organizations participate in the public process concerning US Forest Service management, right?
It’s also worth mentioning that not all of these appeals, objections are from the environmental groups. The timber industry and local governments will often file these too, in our area at least.
So too, it’s worth mentioning that people like you want to use the Northern Region numbers to try and attempt to make a case that appeals and litigation are a big deal all over the country. Unfortunately, the numbers don’t match up with your attempts.
Region: 1, Northern;
Total number of decisions: 132;
Number of decisions: Subject to Appeal: 112;
Number of decisions: Appealed: 40;
Number of decisions: Percent appealed: 36%;
Number of decisions: Subject to objection: 15;
Number of decisions: Objected to: 13;
Number of decisions: Percent objected to: 87%;
Number of decisions: Exempt: 5;
Number of decisions: Percent exempt: 4%;
Number of decisions: Litigated: 11;
Number of decisions: Percent litigated: 8%.
Region: 2, Rocky Mountain;
Total number of decisions: 151;
Number of decisions: Subject to Appeal: 122;
Number of decisions: Appealed: 22;
Number of decisions: Percent appealed: 18%;
Number of decisions: Subject to objection: 21;
Number of decisions: Objected to: 6;
Number of decisions: Percent objected to: 29%;
Number of decisions: Exempt: 8;
Number of decisions: Percent exempt: 5%;
Number of decisions: Litigated: 0;
Number of decisions: Percent litigated: 0.
Region: 3, Southwestern;
Total number of decisions: 79;
Number of decisions: Subject to Appeal: 66;
Number of decisions: Appealed: 7;
Number of decisions: Percent appealed: 11%;
Number of decisions: Subject to objection: 8;
Number of decisions: Objected to: 3;
Number of decisions: Percent objected to: 38%;
Number of decisions: Exempt: 5;
Number of decisions: Percent exempt: 6%;
Number of decisions: Litigated: 0;
Number of decisions: Percent litigated: 0.
Region: 4, Intermountain;
Total number of decisions: 157;
Number of decisions: Subject to Appeal: 137;
Number of decisions: Appealed: 37;
Number of decisions: Percent appealed: 27%;
Number of decisions: Subject to objection: 15;
Number of decisions: Objected to: 7;
Number of decisions: Percent objected to: 47%;
Number of decisions: Exempt: 5;
Number of decisions: Percent exempt: 3%;
Number of decisions: Litigated: 6;
Number of decisions: Percent litigated: 4%.
Region: 5, Pacific Southwest;
Total number of decisions: 251;
Number of decisions: Subject to Appeal: 212;
Number of decisions: Appealed: 35;
Number of decisions: Percent appealed: 17%;
Number of decisions: Subject to objection: 16;
Number of decisions: Objected to: 8;
Number of decisions: Percent objected to: 50%;
Number of decisions: Exempt: 23;
Number of decisions: Percent exempt: 9%;
Number of decisions: Litigated: 5;
Number of decisions: Percent litigated: @5.
Region: 6, Pacific Northwest;
Total number of decisions: 180;
Number of decisions: Subject to Appeal: 139;
Number of decisions: Appealed: 21;
Number of decisions: Percent appealed: 15%;
Number of decisions: Subject to objection: 19;
Number of decisions: Objected to: 10;
Number of decisions: Percent objected to: 53%;
Number of decisions: Exempt: 22;
Number of decisions: Percent exempt: 12%;
Number of decisions: Litigated: 3;
Number of decisions: Percent litigated: 2%.
Region: 8, Southern;
Total number of decisions: 344;
Number of decisions: Subject to Appeal: 301;
Number of decisions: Appealed: 31;
Number of decisions: Percent appealed: 10%;
Number of decisions: Subject to objection: 16;
Number of decisions: Objected to: 1;
Number of decisions: Percent objected to: 6%;
Number of decisions: Exempt: 27;
Number of decisions: Percent exempt: 8%;
Number of decisions: Litigated: 1;
Number of decisions: Percent litigated: 0.
Region: 9, Eastern;
Total number of decisions: 116;
Number of decisions: Subject to Appeal: 100;
Number of decisions: Appealed: 24;
Number of decisions: Percent appealed: 24%;
Number of decisions: Subject to objection: 9;
Number of decisions: Objected to: 1;
Number of decisions: Percent objected to: 11%;
Number of decisions: Exempt: 7;
Number of decisions: Percent exempt: 6%;
Number of decisions: Litigated: 3;
Number of decisions: Percent litigated: 3%.
Region: 10, Alaska;
Total number of decisions: 5;
Number of decisions: Subject to Appeal: 2;
Number of decisions: Appealed: 0;
Number of decisions: Percent appealed: 0;
Number of decisions: Subject to objection: 2;
Number of decisions: Objected to: 0;
Number of decisions: Percent objected to: 0;
Number of decisions: Exempt: 1;
Number of decisions: Percent exempt: 20%;
Number of decisions: Litigated: 0;
Number of decisions: Percent litigated: 0.
Source: GAO analysis of survey and interview results.
Hmm. You are not arguing with the numbers I came up with. What if we take your numbers and ask about fuel treatment projects. Let’s see if we can assume that objections at that time were related to fuel treatment projects, because objections were only allowed under HFRA,
Let’s look at objections in the fire prone west. 1 2 3 4 5 and 6
we get 87 29 38 42 50 and 53%
If we add them up we get 47/94 or 50%.
I never said appeals and objections were a problem in Rs 9 and 8 and I don’t know about 10..
You can look at these number many ways, and the GAO chose to only look at them some ways.
I don’t know about basketball but assume that 50% would mean a % of free throws to miss that would not be desirable.
Sharon, I don’t think we can “assume that objections at that time were related to fuel treatments projects.”
I think the correct assumption is that objections were related to some of the more aggressive logging and/or roadbuilding aspects of the project. To infer that the objections were to strictly bona-fide fuel reduction work around homes or towns is totally not a correct assumption.
Also, the “objection” process is part of the established public process. Furthermore, the “objection” process comes long before any actual decision has been made. The very nature of the “objection” process results in more “objections” being filed. Ironic, I know, but true just the same.
P.S. How many fires burning this year are actually burning in areas where legit fuel treatments were proposed, but opposed or delayed?
Hmm… I don’t know what the objections were about.
Here is my logic path…
GAO says appeals and objections do not slow down/have an effect, etc. because the percentage is so small. They refute the observations of those currently working. Because there are few appeals in the Black Hills can hardly seem satisfying to a district in Montana.
I say it’s a function of the scale and projects they look at. (I said that before they finished their first study and they seemed to ignore that feedback). I received the impression that they were not very open-minded at that point. Which is not what you are looking for from folks doing studies trying to get at perceived problems.
I looked at objections in western regions which had to be for fuel treatments and came up with a different answer, 50%
You say that it’s a public process. That’s not an issue.
You say that the objections were only about the “bad” parts of the project.
That’s not the issue either. My point is that there are different ways of looking at the same data that lead to different answers. The GAO’s conclusions were one of many possible interpretations.
.
Sharon, I too spoke with GAO people before the release of this report. Not every point I made came through either, but that’s just the way it goes.
I agree that we don’t know “what the objections were about” and that’s part of the problem. Do you think, for example, that of the 22 official “Objections” filed on the Middle East Fork HFRA project on the Bitterroot that “Objections” from the timber industry brought up the same issues as the “Objection” I wrote? Likely not.
Funny, but the GAO report spends a fair amount of time covering the Middle East Fork HFRA project….at least certainly more time than on any other project in the country. Why is that? Might things be a little different in Montana? Is our environmental community different? Is the timber industry different? Do we have species concerns that aren’t issues elsewhere? How about the Ravalli County Commissioners? More info on that project is here. http://www.nativeforest.org/middle_east_fork.htm
Again, “objections” are part of the official public participation process set up the Congress of the United States. “Objections” must be submitted BEFORE any decision is made, so often times “Objections” can’t be that specific because nobody knows what the final decision will be.
I’ve often wondered about the semantics at play here. For example, what if instead of the word “objections” that part of the process was called “suggestions?” I mean, in a way, that’s all the public who participates in the “objection” process is doing…making “suggestions.” Do you think people would “object” to those who file “objections” so vigeriously if “objections” were simply called “suggestions?”