This post relates to an earlier post with regard to this news story from OPB/Oregonian/Propublica and follows up on 2ndlaw’s question about how the federal payment decrease should be calculated here, I contacted Mark Haggerty from Headwaters Economics. Many thanks to Mark for his help and patience in explaining this complex and arcane world. At the end of this post is a link to a paper that describes the history and also proposes a solution, so if this post is too much in the economic weeds for you, skip to #4.
Framing the Issue of Comparing Losses:
I don’t really know why the reporters decided to compare losses to counties from Severance+ to those from decreases in federal payments. If the point was to say “Oregon doesn’t tax timber enough compared to other states,” you don’t really need those specific figures, you would just compare the overall tax structures.
Perhaps the point of comparing them was probably to say “people talked a lot about losing income from the spotted owl changes, but hey look, communities are also suffering from having too much private forestland and the current tax structure for forest products companies.”
So maybe the details of “relative badness” don’t matter.
********************************************************************
Nevertheless, rooting around in the weeds with Mark Haggerty of Headwaters Economics produced the information below. The bottom line from Mark is:
“So the “loss” on the federal side is overestimated in my opinion. That said, there is no question that the loss is significant under any scenario.
2nd Law asked: “How did you (they) calculate revenue loss from federal lands? Did you include all the safety net and SRS payments that are not directly coupled to timber sales? These payments to local govt tend to vastly exceed the flow of economic benefits from private forest land. And they have lasted quite a while.”
1. Mark Haggerty’s response to 2nd’s question:
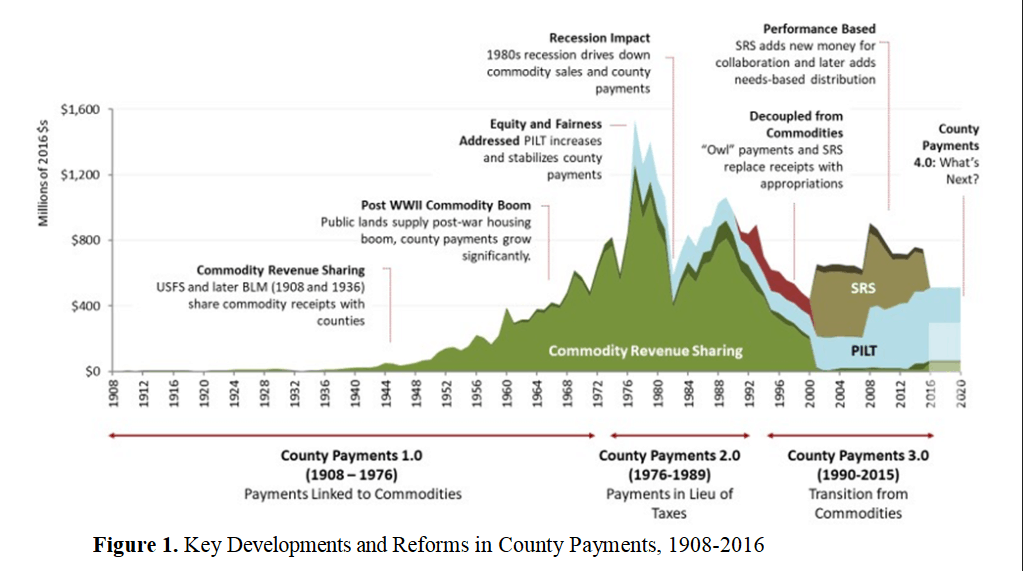
“The data I shared with Tony* do include appropriated Forest Service and BLM O&C payments including transition payments beginning as early as 1991 for the BLM counties, NW Forest Plan “owl” payments after 1993, and SRS after 2001.
They also include PILT, an acreage-based formula payment adopted in 1976. Counties must subtract prior-year payments from their entitlement amount, so in theory PILT compensates for declining Forest Service payments. But BLM O&C payments are exempt from the PILT formula and many small population counties are limited by the ceiling in the PILT formula so they are largely uncompensated for declining Forest Service payments. Payments for education are not compensated by PILT, which only goes to county governments.
The problem now, of course, is that SRS still must be authorized and appropriated on a recurring basis and does not appear to be a permanent solution for counties. I have worked with NACO for years on a permanent SRS fix that would increase payments over time by establishing an endowment financed with commercial receipts. It is introduced as the Forest Management for Rural Stability Act (S. 1643) by Senators Wyden and Crapo. “
- (From Mark) Note that I didn’t do the calculations, the authors did. The data come from the Economic Profile System which is free to the public. You can find it here: https://headwaterseconomics.org/tools/economic-profile-system/. Run the “Federal Land Payments” report for any county in the U.S. EPS includes all the payments listed.
2. And here is one problem with my (Sharon’s) simplistic “the more federal west side timberland a county has, the more likely they were to be more impacted by federal decreases than by severance+”.
“To answer your question, the data do include the BLM O&C payments. Note that the O&C payments are not distributed to counties based on where trees are cut. The total value of harvests across all O&C lands are allocated to counties based on the relative taxable value of the O&C lands as of 1916. Multnomah county receives by far the largest share of payments on a per-acres basis, but not total because it has fewer O&C acres overall. Forest Service payments are allocated to counties based on their proportional acreage of each PNF. “
- (From Mark) The O&C formula described is in use when counties do not receive SRS. SRS has a more complex formula (yes, it’s true) that includes historic payments and adds factors for the number of acres of O&C lands in each county, and an economic adjustment based on relative per-capital personal income in each county. Relatively “poor” counties receive higher SRS payments, and vice-versa. The Forest Service SRS formula is the same, except that it uses historic FS payments and FS acres per county.
3. Reasonable people could disagree on ways of calculating “what might have been” given that no one knows.
“Tony estimated “lost” federal payments by comparing the median payment since the NW Forest Plan to the historic median payment in the three decades prior to the NW Forest Plan, a period that included historically high payments in the 70s and 80s. I would not have done it that way. It assumes that without the NW Forest Plan, harvest levels and timber prices would have remained at historically high levels right up to the current year. I don’t know what the actual harvest value would have been, but I don’t think it would have remained the same given structural changes in the economy and specifically in the timber industry. So the “loss” on the federal side is overestimated in my opinion. That said, there is no question that the loss is significant under any scenario.”
4. Why other economic activities don’t pay the bills.
I don’t think that this aspect was touched on in the OPB/Oregonian/Propublica article. “The other thing that plays importantly here is Oregon’s tax revolt in the 90s. Counties remain dependent on timber (severance, property and federal payments) because other economic activities essentially don’t pay the bills. So economic diversification isn’t a real option from a fiscal perspective. Here’s an article I wrote that dives into that issue in some detail: https://digitalcommons.humboldt.edu/hjsr/vol1/iss40/12/”
The graph is really helpful. Relative to the original article, it would be even more helpful to see county revenue from private land timber taxes stacked on top of it.
That’s true, but what you might lose are the county by county impacts. It doesn’t help to know that Portland is booming, when you live in a county that isn’t a popular housing/recreation area. The impacts are felt community by community.