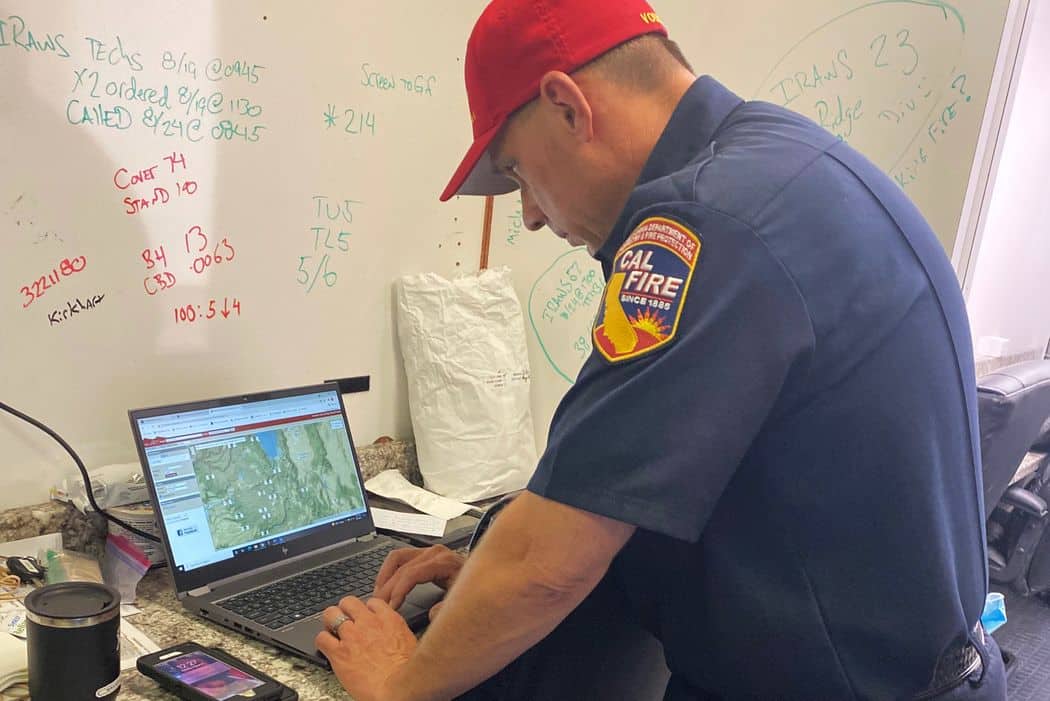
PHOTO: JIM CARLTON/THE WALL STREET JOURNAL
Thanks to Rebecca Watson for this link to a story in the Wall Street Journal. Well worth reading in its entirety.
Here’s an excerpt:
The Forest Service’s Moneyball effort began in 2017, spurred by growing alarm within the agency at the emergence of complex “megafires,” blazes of more than 100,000 acres. Forest Service researchers Matthew Thompson and Dave Calkin enrolled in an MIT course on how the data-analytics movement that was revolutionizing professional sports could be applied to other businesses.
The two said it got them thinking: If the Houston Rockets’ then general manager, Daryl Morey—known for using analytics—could use data to conclude that three-point shots were a more efficient way to score than midrange jumpers, could a similar concept be applied to firefighting resources?
Fire crews are increasingly relying on data-driven models dubbed “Moneyball for fire” within the U.S. Forest Service because they were developed in part by researchers who studied sports analytics at the Massachusetts Institute of Technology. The models take their name from the Michael Lewis book “Moneyball: The Art of Winning an Unfair Game” about how an Oakland Athletics general manager, Billy Beane, crunched numbers to assemble a winning team on a limited budget, where the intuition of team scouts had previously dominated baseball decisions.
Fire Behavior Analyst Glen Lewis views wildfire-modeling tools at the incident command post forfires including the Divide Complex in Montana last month.The new wildfire models are more sophisticated than more-rudimentary versions used in the past and help firefighters determine how to most effectively deploy limited resources. “It used to take me four to five hours to draw a fire map,” said Mr. Volmer. “Now I can plugin a program and it will spit out all my data in about five seconds.”….
The programs can then churn out various models to predict what the fire will do in the short, near and long term. Analysts can also use the models to simulate thousands of artificial scenarios during an even longer period to predict where a fire might spread under various conditions.
“The models are looking at the history of these landscapes and saying: These are the places where fires traditionally stopped,” said Mr. Calkin. “These are the conditions and locations where you could stop them; and this is where it is probably really ugly to put your people.”
Mr. Thompson and his team began doing presentations around the country for veteran wildland firef ghters, trying to convince them that the numbers they were crunching could help inform their decisions. The team used maps showing the efficiency of the Houston Rockets’ shot selection to illustrate how to better use air-tanker drops by deploying them in locations with a high probability of controlling a fire.They stressed that the fire crews still needed to affirm the models with what they were seeing. That information would be fed into the models to help make them more accurate. Where crews once mapped out fires by driving around or flying over the blazes, the Moneyball team could instantly show a fire’s projected path under various scenarios.
Mr. Thompson said his group’s persuasion eff orts reminded him of a scene from the film version of “Moneyball,” when a scout tells the A’s Mr. Beane, played by actor Brad Pitt, that baseball teams aren’t picked with numbers but with the scout’s gut, drawn from decades of experience. “I was in rooms where that exact sentiment was expressed,” he said.
And what do “on the ground” folks think?
Among skeptics was Rob Powell, wildfire operations chief for South Dakota. “They brought us this big pretty map with all these colors—it was like ‘Tell us something we don’t know,’ ” he said of his introduction to the models in 2018. “But now I see some of the value—especially when I can see the fire on their models before I get there.”..
Rick Stratton, a Forest Service fire-modeling analyst, said the Moneyball models were used to help fight 11 big fi res in 2017, 19 the next year and more than 90 so far this year.
One of its biggest successes this year came in the 70,000-acre Tamarack Fire, which burned in California and Nevada , started with a lightning strike south of Lake Tahoe on July 4. Mr. Stratton used modeling to show it headed toward several small communities along Highway 395 in western Nevada.
Dan Dallas, the supervisor of the Rio Grande National Forest in Colorado, who also commanded firefighting operations on Tamarack, used the modeling to request a surge in fire crews. An interagency group made up of federal and state agencies dispatched five elite “hotshot” crews to the area, helping keep the fire from destroying more property, Mr. Dallas said.
” … the fire crews still needed to affirm the models with what they were seeing. That information would be fed into the models to help make them more accurate.”
I can foresee this type of analytical information being used to settle some questions about the actual effects of fuel thinning and controlled burning practices on fire behavior after a fire has already happened, a sort of post mortem evaluation to refine assumptions and future practices.
“The models are looking at the history of these landscapes and saying: These are the places where fires traditionally stopped,”
The implications for forest planning seem obvious – these areas should emerge as potential priorities for long-term management that reduces fire risk. The priority should also be based on a determination during the planning process that there are values at risk that this would protect, but it should also be ecologically appropriate for areas that historically stopped fires to be managed for that purpose.