The OG EIS is mercifully short, thanks to all you folks who worked on it! Only 162 pages and there are lots of references. Also many interesting charts and tables, which I’ve posted below.
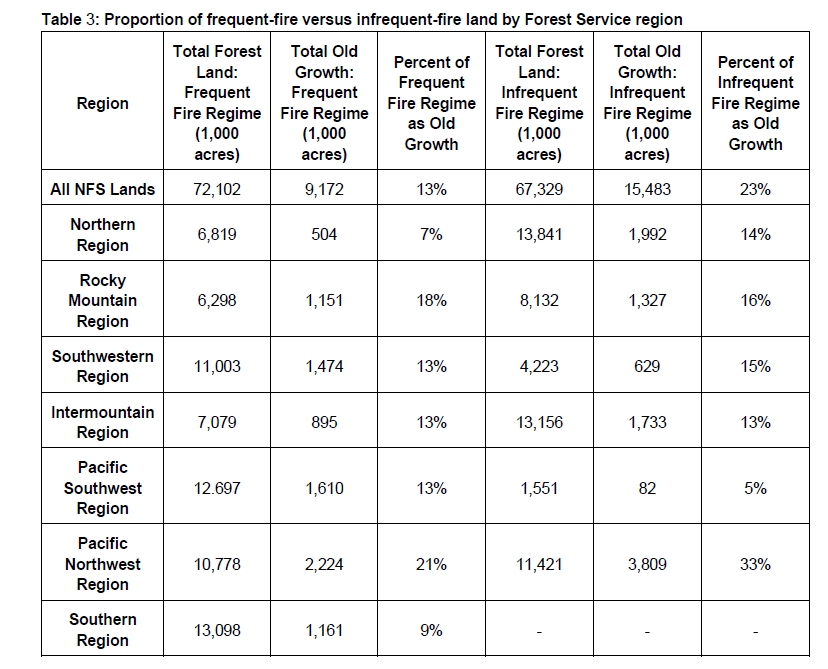
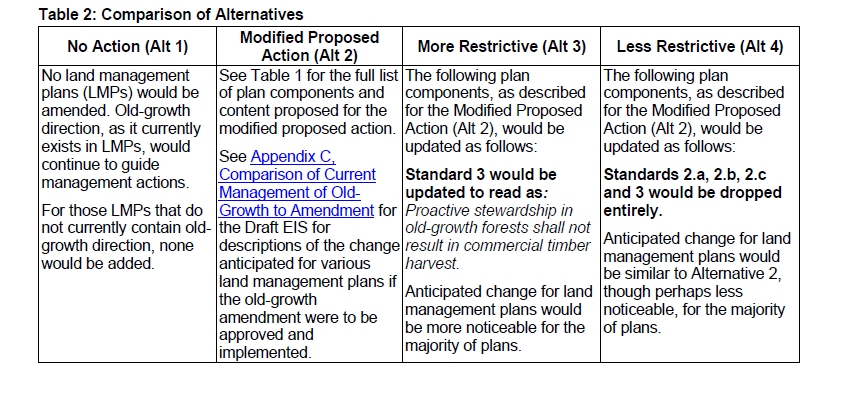 This is the most important table, other than the list of plan components.
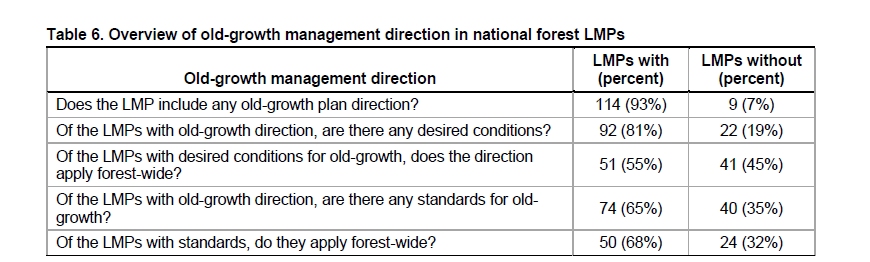
I wonder why OG plan components wouldn’t apply forest-wide to OG?
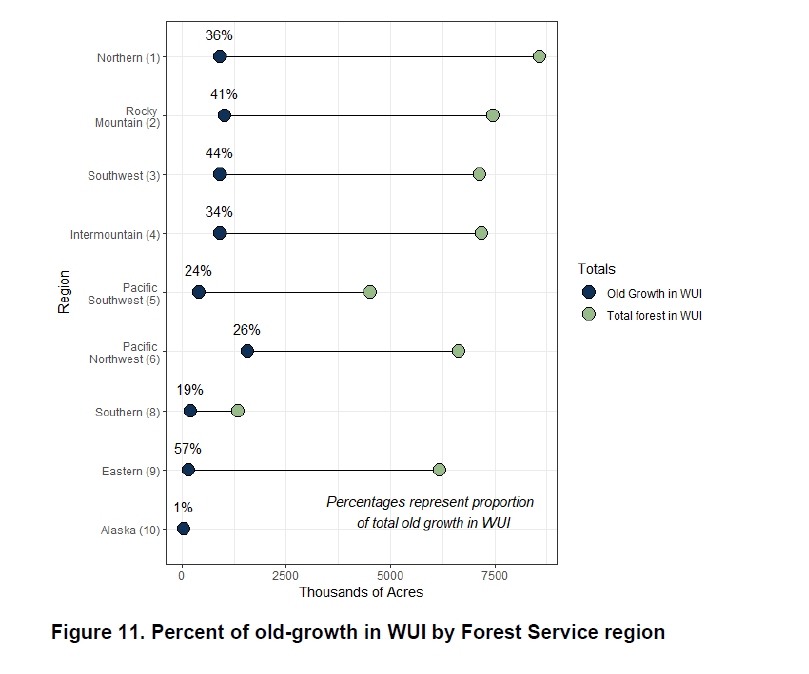
Figure 11 surprised me as to the percentage of OG in WUI. 57% in R9!
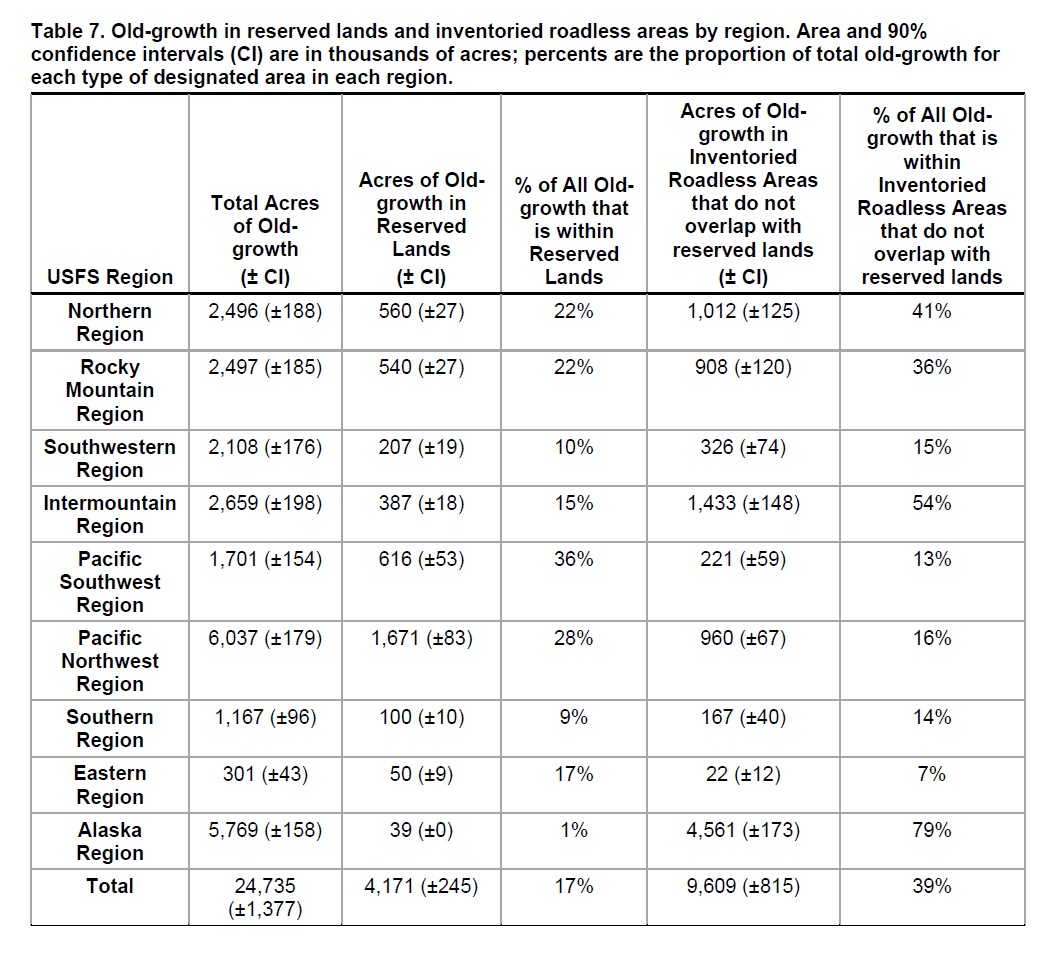 What are reserved lands? “For purposes of the FIA inventory data, the term “reserved lands,” is defined to include the following types of designated areas: Wilderness, National Wild and Scenic Rivers, National Monuments, National Recreation Areas, and National Scenic Areas and the term “Inventoried Roadless Areas” is defined to include areas identified in state-specific roadless rules or the 2001 Roadless Rule, which limits timber harvest and road construction on these lands. Estimates of acres of old-growth in designated areas are based on Forest Inventory and Analysis (FIA) plots that are within reserved lands or within Inventoried Roadless Area that do not overlap with reserved lands (pp 78-79). I think (thought I could be wrong) that you would add the numbers or percentages to get the acres or percents in reserved and roadless (mostly not open to commercial timber harvest), say 63% of the OG in Region 1 is in reserved or roadless.
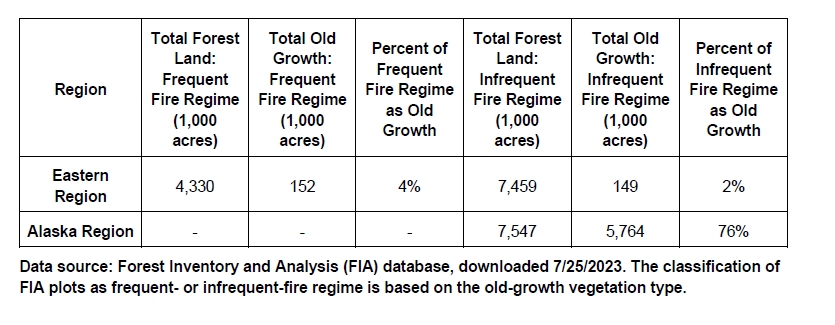
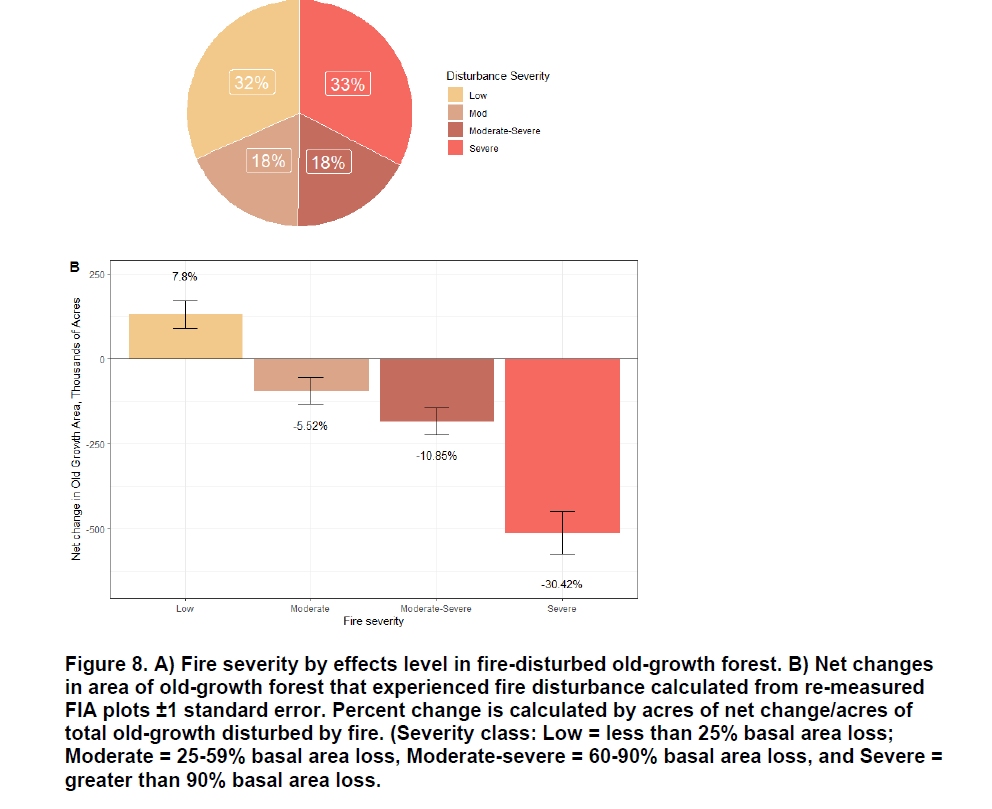 I think this means low severity fire led to increases in total old growth?
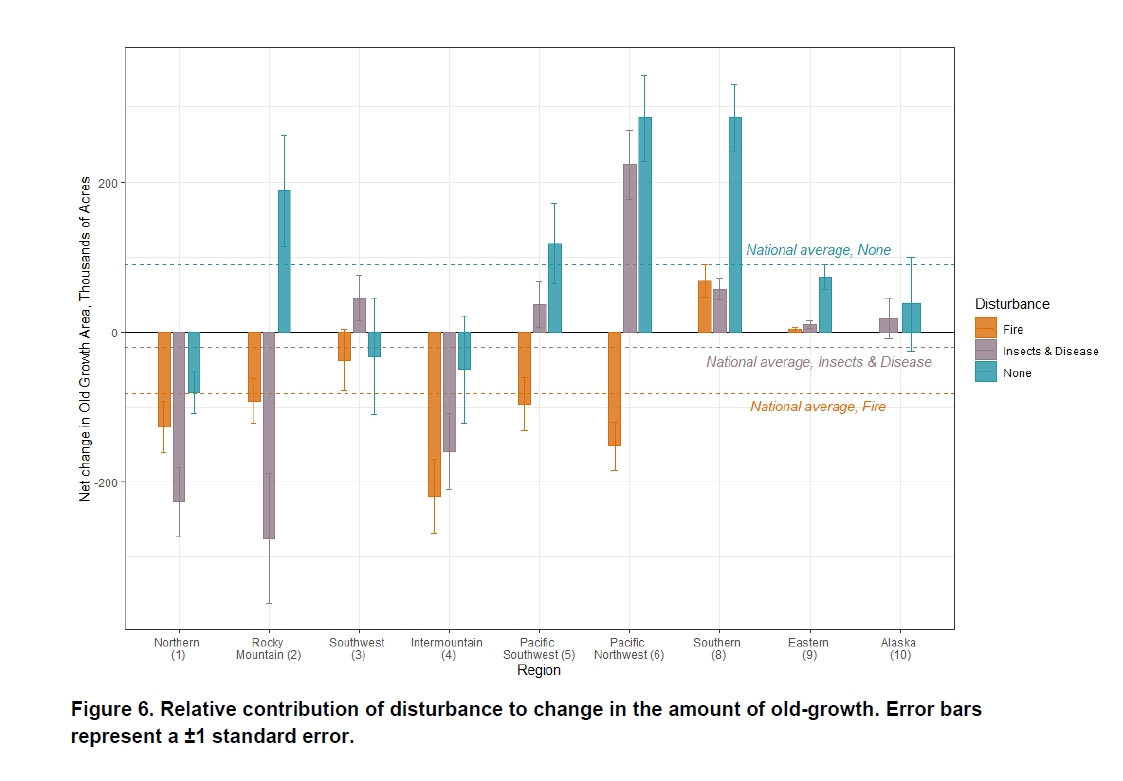 If I read this correctly, Regions 1,2 and 4 are the worst for insect and disease taking out old growth.. sounds like LPP might be a factor at least in 1 and 2.
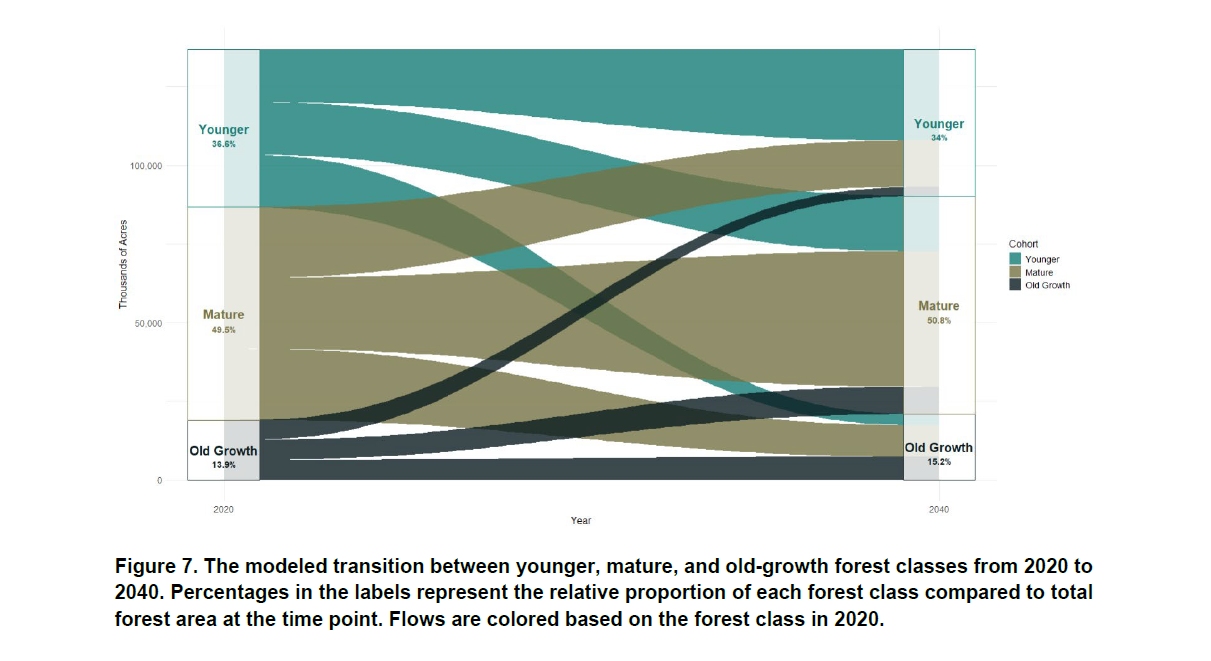
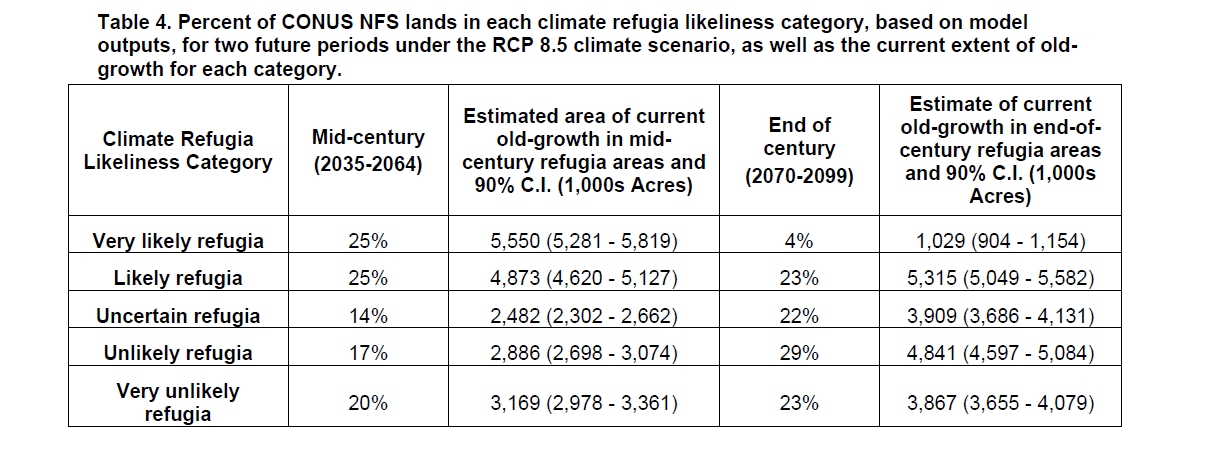 I’m not a fan of 8.5, nor assuming no adaptation by tree species. I think there’s a great deal we don’t know about the future, except maybe old LPPs are likely to die from mountain pine beetle..
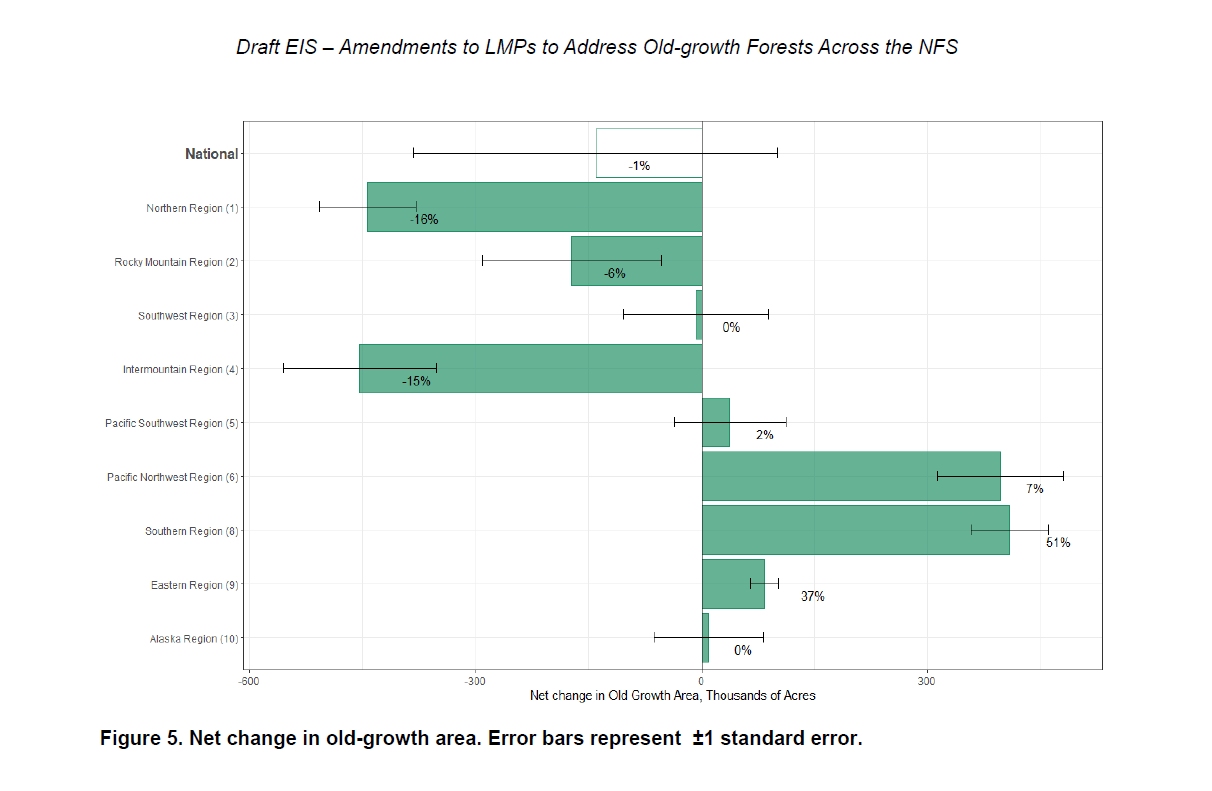 This is from FIA data between 2000 and 2020. Page 67 says “However, at the regional level, there is important variation in net change of old-growth forest. Some regions, such as the Northern Region and the Intermountain Region, have seen declines of more than 400,000 acres during this period. The Pacific Northwest and Eastern Regions, on the other hand, experienced an increase of approximately 400,000 acres of old-growth. This represents approximately a seven percent increase for the Pacific Northwest Region and approximately 50 percent increase for the Eastern Region.” (I wonder whether they mean the Southern Region.)
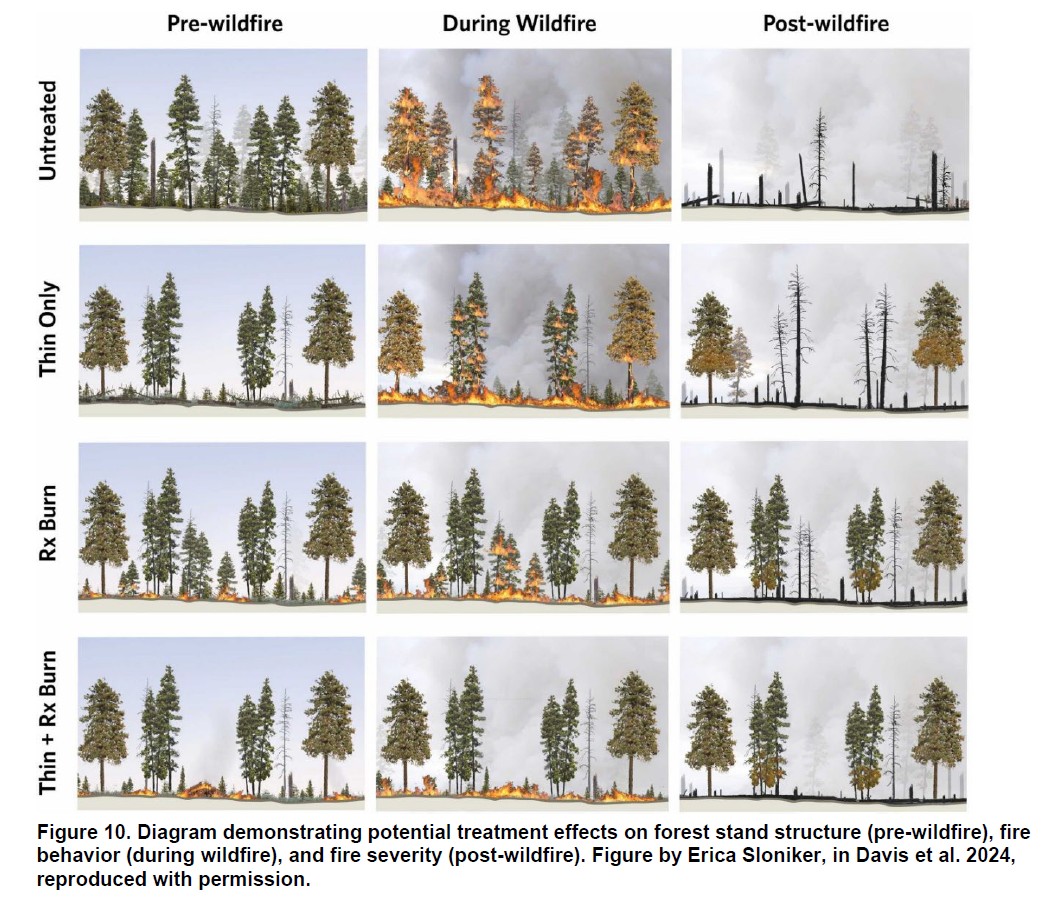
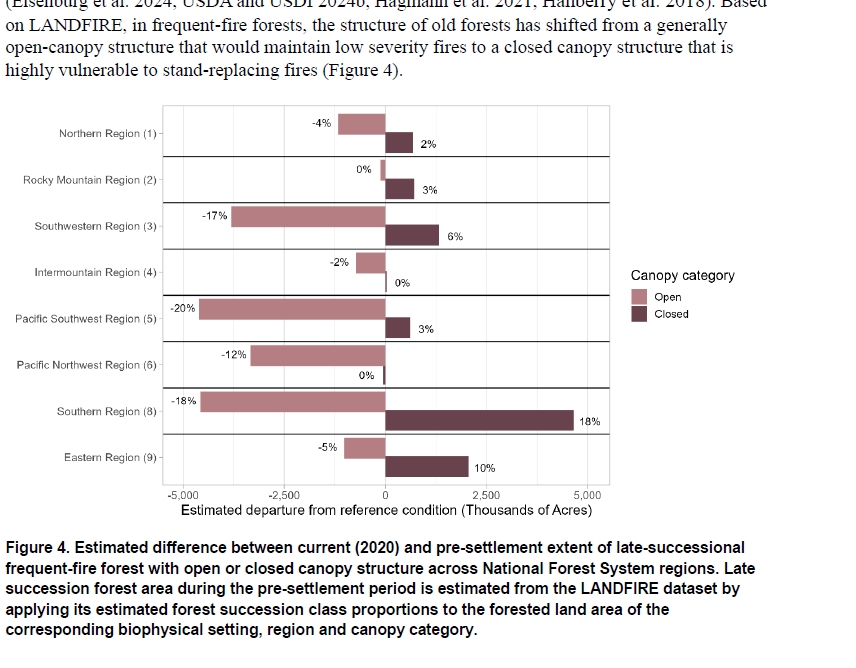 I’m not a fan of “pre-settlement”, perhaps “pre-colonization” instead? Many Tribes were settled. I also think that it would be important to think about “do we want to try to replicate conditions before decimation of Indigenous populations or after?”
 Interesting stuff! Remember, based on FIA.
If Foresters and other scientists cannot (or will not) agree on what is “old growth” and what is “mature”, how can we expect the ones with the paint guns to be able to make those snap decisions, in the field? (Remember, some of them don’t even know all their local tree species.)
“I wonder why OG plan components wouldn’t apply forest-wide to OG?”
I’m guessing they made distinctions by management area, so that in some MAs, this wasn’t something to worry about. If we already had universal forest-wide OG protection, they wouldn’t be doing this amendment.