Forest Legacy 2024 Funded Projects… and Using the Climate and Economic Justice Screening Tool

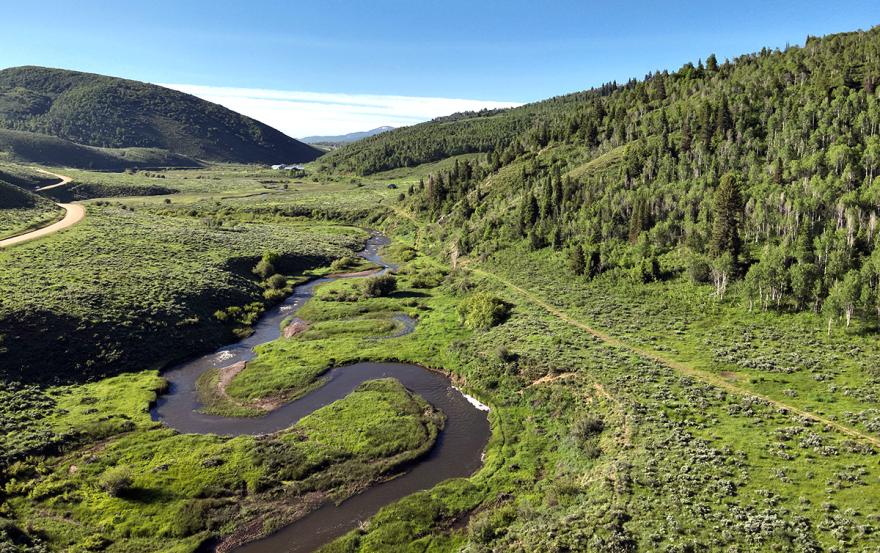
The Wasatch Back Forest Conservation Project received funding in 2024 through the Forest Legacy Program, conserving 8,588 acres just 25 miles from Salt Lake City, UT. (Photo by the Utah Division of Forestry, Fire & State Lands)

Folks have sent me some articles about the Chief’s testimony last week on the budget. From what I’ve heard and the stories, Congressfolk don’t seem as interested as retirees (including Dave Mertz and I, as well as others)  in the Keystone Agreements and exactly where the funding is going, producing annual reports with details and so on.  We were told “you can FOIA it” and my usual sources of info have dried up.

I’ve pointed out that we have nice reports on GAOA funding and where it goes, and Forest Legacy Funding via LWCF (Land and Water Conservation Fund). So my hypothesis is that it’s important to be transparent so that Congress continues to provide funding. The Keystone Agreements are conceivably one and done, so maybe that is why there’s so little perceived need for reporting or accountability? Or maybe the funding is going towards more capacity-building or planning so it’s harder to describe any outcomes or outputs. Or maybe it’s all there somewhere on a website and I missed it.

Anyway, back to Forest Legacy. Their site shows the specifics of each project, how many acres, partners and why each particular chunk of land is important.

The press release refers to “conserving” 168K acres of forestland. I still wonder whether conservation is defined differently between USDA and Interior. If not, then “conservation leases” could include (sustainable) timber harvest.

USDA’s Forest Service is providing more than $154 million through its Forest Legacy Program for 26 projects to conserve working forests that support rural economies in 17 states. This conservation work is made possible by more than $84 million from the Land and Water Conservation Fund and nearly $70 million from President Biden’s Inflation Reduction Act – the largest climate investment in history and part of the Investing in America agenda.

Through the Forest Legacy Program, States work with local communities to identify private forestlands and develop proposals to conserve these lands as forests for their values as places for recreation, as wildlife habitat, and as sustainable sources of wood and other forest products. The Forest Service then selects the top proposals for funding through an entirely voluntary competitive process and provides grant funding to States. Some of this land will stay in private ownership and will be permanently protected and conserved as forests, while States will purchase other parcels to be managed as public land.

The Forest Legacy Program is also part of President Biden’s Justice40 Initiative, which sets the goal that 40% of the overall benefits of certain federal investments flow to disadvantaged communities that are marginalized by underinvestment and overburdened by pollution. Communities around the nation depend on forests, and the effort to conserve private forestlands will benefit Tribal Nations and other disadvantaged communities. Nearly 50% of these investments will go to conserving forests near disadvantaged communities identified by the Climate and Economic Justice Screening Tool.

But the Screening Tool doesn’t just address disadvantaged folk and pollution- so the policy and the tool don’t seem to match.

You’ll remember that I posted before here and here about the Screening Tool and its questionable protocols and data sources.

A 30-meter resolution model projecting the wildfire exposure for any specific location in the contiguous U.S., today and with future climate change. The risk of wildfire is calculated from inputs associated with fire fuels, weather, human influence, and fire movement. The risk does not consider property value.
Used in: Climate change category
Responsible party: First Street Foundation
Source: Climate Risk Data Access from 2022
Available for: All contiguous U.S. states and the District of Columbia

Both flood and fire risk take into account projected climate change- I couldn’t figure out which SSP is mapped in the CEQ EJ map. I found this update interesting from last year interesting..

The model update includes the migration from Representative Concentration Pathways (RCP) to Shared Socioeconomic Pathways (SSP), which allows for more precise assessments based on different climate scenarios. The Foundation is also expanding the flood and wind modeling to include multiple pathways, such as SSP 2-4.5 and SSP 5-8.5. Additional SSP pathways for wildfire and extreme heat scenarios are being developed for future releases this year.

I wonder whether new information about new mitigation, fuel treatment projects, etc. would show up in updates of the tool? I wonder whether it is updated? I think it’s a great idea to map the disadvantaged, but some of the criteria (not to speak of the ways the numbers are calculated) seem questionable. Given that poor people are less likely to be able to respond to any disasters, why not focus on that? And if the examples in the Forest Legacy are any indications, folks on the ground are quite capable of describing how their projects partner with Native Americans or help the poor.

As it turns out, the project scoring guide for FY 24 did not mention the maps

Benefits of projects for underserved communities and environmental justice initiatives should be highlighted where applicable. For example, benefits can be discussed within economic
benefits, water, cultural, public access, or climate resilience. Benefits for underserved communities can also be discussed in the Strategic section. Underserved communities: “underserved communities” refers to populations sharing a particular characteristic, as well as geographic communities, that have been historically underserved, marginalized, and adversely affected by persistent poverty or inequality (pursuant to Executive Order 13985, Advancing Racial Equity and Support for Underserved Communities Through the Federal Government). Namely, these are Black, Latino, and Indigenous and Native American persons, Asian Americans and Pacific Islanders and other persons of color; members of religious minorities; lesbian, gay, bisexual, transgender, and
queer (LGBTQ+) persons; persons with disabilities; persons who live in rural areas; and persons otherwise adversely affected by persistent poverty or inequality

From the “good government” perspective, I wonder whether a narrative addressed to those concerns may actually have better information than an un-updated map with unknown data quality. The best science and all that. It also sounds like looking it up on the EJ maps was an afterthought, and it turned out that the more local information actually led to “nearly 50%” being on the map.

But all agencies are apparently supposed to use this tool, according to the Q&A

The Council on Environmental Quality (CEQ), the Office of Management and Budget (OMB), and the Climate Policy Office (CPO) released the Justice40 Interim Implementation Guidance on July 20, 2021. It directed agencies to develop interim definitions of disadvantaged communities. Agencies used their interim definitions during the tool’s beta phase. Agencies will now transition to using version 1.0 of the tool to geographically identify disadvantaged communities.

So I think most people are trying to do good things, and we disagree about how best to go about it. But using ungroundtruthed data and then telling agencies that they must use it instead of what they know in the real world seems problematic to me. There seems to be a tendency to centralize decisions based on broadscale “data” (the Satellite Gaze) and privileging that over local information. Often there is no transparent effort to ground-truth these maps. That would involve intentionally requesting feedback, posting the feedback, and discussing how that feedback was used to improve the models or data collection methodologies behind the map.

Choosing those sources of data and those manipulations can also centralize political power and decision-making, either in the name of efficiency or the name of “science.” What is the best data- for a given purpose, though, is ultimately a political decision. And just because data is available doesn’t mean that it’s good or relevant.

Finally, let’s circle back to the Keystone Agreements. Must they follow the Justice40 Initiative? How will we know if they do if the project data isn’t available?
All the News That Fits the Narrative; Rock Springs RMP, Schuller Interview with EPA EJ Administrator

We’ve been having a discussion on various aspect of the Rock Springs Wyoming RMP.   A few things have come my way that are of interest relating to that, and also the role of communities.
******************
First, Tisha Schuller talks with the deputy assistant administrator for EJ at EPA’s Office of Environmental Justice and External Civil Rights on her Energy Thinks podcast. I didn’t listen to the whole thing but she shared a few quotes.
On EPA’s growing focus on EJ: 
“It is the first time in government—not just in the United States but in the history of humankind—that we have real funding at the same time that we have real political support not only to change the systems and structures of governance but to do so in an equitable way.”

Hmm.. count me skeptical as to the role of one federal agency (or even the current Admin, which is, after all one of three branches of the federal government) in changing “the systems and structures of governance” in an “equitable way.” Not that I have a problem with equity, but I think its use and meaning are contested.

And
On placing communities at the head of the table:
“None of us want to live in a place where we’re not heard. None of us want to live in a community where things are done to it and you don’t have anything to say about it. None of us want to live in that place. Communities with EJ concerns want to be heard.”

“Communities with EJ concerns” is a term also used in the proposed NEPA regs (more on those next week). Rather than define what EJ communities are or aren’t, we now have communities with concerns. For example, my somewhat neighboring community of Kiowa is not thrilled about new high voltage powerlines (this is all private as part of Colorado’s Power Pathway, so no federal nexus except for endangered species and National Park viewsheds). There are quite a few different parameters that could be indexed in different ways (for example, east of there is a food desert). So depending on the way you index, it could be an EJ community or not. If you were to define what one is. But any community seemingly could have EJ concerns, and is there an arbiter of what are legitimate concerns or not? It’s all not exactly transparent or clear. In my experience, when people dream up abstractions and are intentionally not clear about who is in and who is out.. other people are making the determination, usually for small or large political reasons.

Of course, there’s “being heard” and “having your say determine the outcome”; plus not all people in communities agree. People in the federal land management space know this landscape quite well over many decisions large and small. It seems in the broader world of new energy buildout, other organizations and NGOs are discovering these complexities.

*****************
The NY Times on Rock Springs decision..

This was quite timely. Note the tagline ..

Explosive reactions to the proposal, which would limit drilling, show how the president’s climate policies are crashing into walls in some oil and gas states.

The journalist, Lisa Friedman (no relation) seems like a nice person. At one Society of Environmental Journalists meeting I attended, she (and other reporters from Coastal Media) seemed extraordinarily interested in Pendley’s (he was there) attitude toward climate change. As if somehow the BLM were the key to worldwide decarbonization. It felt a little weird to me, especially since I wanted to ask him about e-bikes. Oh well.

As a candidate, Mr. Biden pledged to end new federal oil and gas leasing. And, as president, he has said he wants to conserve at least 30 percent of public lands and waters by 2030. Both are part of an aggressive agenda to curb climate change, though Mr. Biden has approved some large fossil fuel projects. Political and legal concerns have played a role in those decisions.

I guess you can state that “conserving” 30 percent of land” is an “aggressive approach to curb climate change, but I wonder whether if the protected areas don’t allow fuel reduction.. they actually do that. Plus some of us might see a conflict between renewable build-out and “conserving.” Without a map, though, why would we believe that they are compatible? Otherwise it’s just political arm-waving attempts to placate renewable and ENGO interests. And as we have seen with the BLM conservation rule and the proposed CEQ NEPA regs, when renewable buildout and “protection” meet, renewables lose.

“We are in a bit of a bubble here right now with Ukraine and the Middle East,” said Mark Squillace, a law professor at the University of Colorado Boulder. Mr. Squillace said if oil prices climbed there could be heightened interest in federal oil and gas leasing, but only in the short term.

Mark is another great person, and I’d like to think we’re in a “bubble” but I don’t know what our foreign policy will be nor how others will react. The fact is that no one knows.

“I think we all know that in the next 20 years or so there’s going to be a whole lot less oil and gas production, because of the trends that we’re seeing with electric vehicles and renewable energy,” Mr. Squillace said. Wyoming, which also is grappling with collapsing demand for its coal, he added, “should, of all states, know the consequences of not managing their land.”

I don’t understand exactly what that means.

Ah.. the “backlash”

The backlash began almost immediately. Lawmakers accused the Biden administration of trying to pull Wyoming “back to the Stone Age.” Governor Gordon sent a letter to the Bureau of Land Management director asking the agency to withdraw the entire plan. A local sheriff declared he would not enforce the plan if it were finalized.

The director of the Bureau of Land Management’s field office in Rock Springs, Wyo., Kimberlee Foster, told a local news outlet that her staff members had begun receiving threatening calls were being investigated by the F.B.I. “It’s not really about specifics in the document,” Ms. Foster said. “The hate has been more political in nature.”

Pivot to “incipient Bundys”. Lawmakers quote.. Governor Gordon’s letter (which was pretty mild for a politician), a sheriff.. yup.

“The situation is ripe for this sort of anger to come to the surface,” said State Senator Brian Boner, a Republican. He noted the federal government already owned nearly half, 48 percent, of Wyoming land. “You feel like you don’t really have a voice in the way your state moves forward, and in this instance there’s a significant threat to peoples’ livelihoods,” he said.

So let’s go back to Tisha’s podcast:

None of us want to live in a place where we’re not heard. None of us want to live in a community where things are done to it and you don’t have anything to say about it. None of us want to live in that place

What’s interesting about the Times story is that it’s all about oil and gas, not about the process, which is what Gordon’s letter was about. Does not mention the political back and forth concern, as in the Cowboy State Daily report discussed previously, and as we shall see there’s other info not included.

Indeed “all the news that fits the narrative”. Oil and gas bad and not needed, check. Republicans bad, check. Westerners dangerous and incipient Bundys, check. Are the facts wrong? Probably not. Does fitting the info to a narrative leave a lot out and not actually help our understanding of what’s going on? Yes.

Good thing we have the Cowboy State Daily and Wyofile!

Exploring the EPA and CEQ Environmental Justice Maps: The Dangers of Mapping and Policy Snowballs

All of the maps in this post can be clicked on to see more clearly.

This is the second in two posts about the Justice 40 Initiative and the EPA and CEQ maps.  The CEQ map is called the “Climate and Economic Justice Screening Tool” while the EPA map is called the Environmental Justice Screening and Mapping Tool.  That’s why I first became curious about these efforts… something like “how many agencies does it take to map screwing in a light bulb?”

For those of you concerned about government duplication and inefficiency, it appears that both maps use the same Front Street data. I’ll talk some more about that data source in another post.

I’d like to call your attention to a couple of things, though.

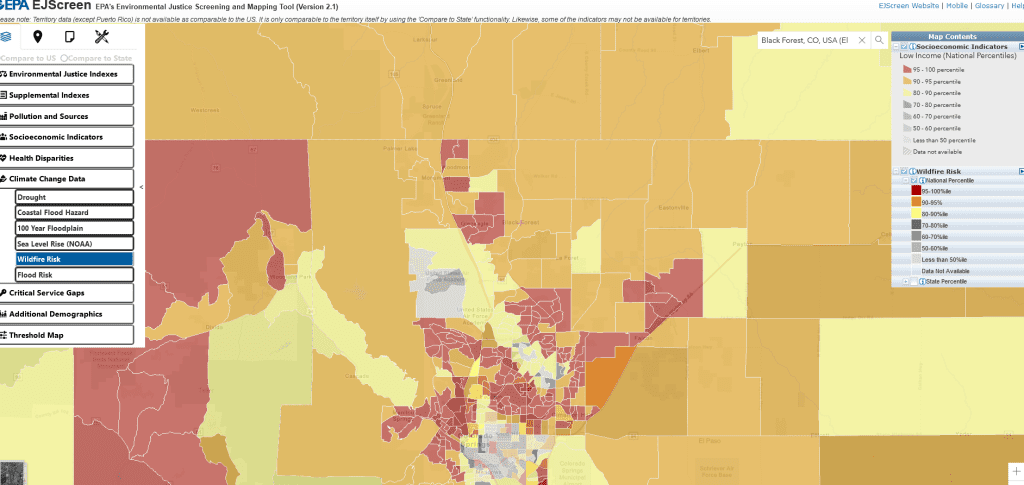
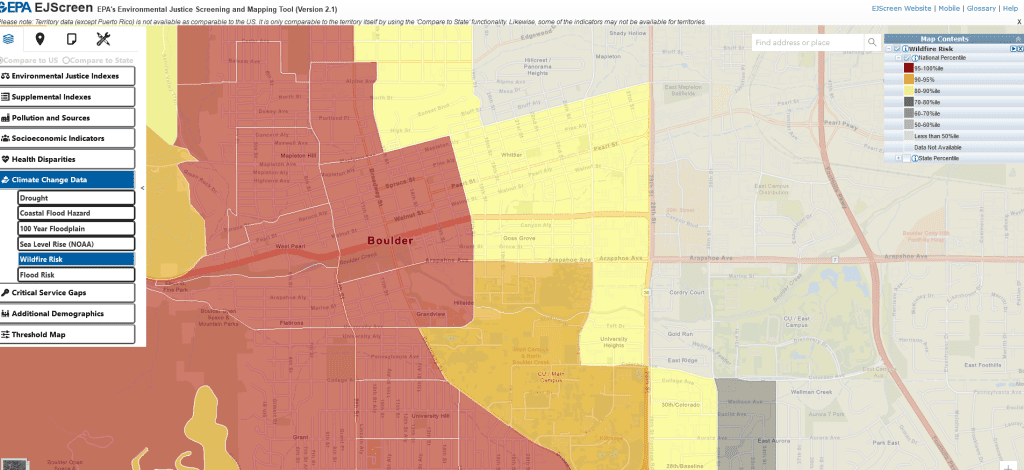
(1) According to the EPA map, all these topics are “climate change”.  Drought, coastal flood hazard, 100 year floodplain, sea level rise (NOAA), wildfire risk, and flood risk. So it appears that risks may already have climate change already modeled into them.  Fortunately for wildfire we can look at the Front Street results and find they used a reasonable 4.5 scenario. But it’s not particularly clear that all these estimates used the same one, or that they modeled climate the same way. Perhaps it doesn’t matter as EPA says

Screening tools should be used for a “screening-level” look. Screening is a useful first step in understanding or highlighting locations that may be candidates for further review. However, it is essential to remember that screening-level results:

  • do not, by themselves, determine the existence or absence of environmental justice concerns in a given location
  • they do not provide a risk assessment and
  • have other significant limitations.

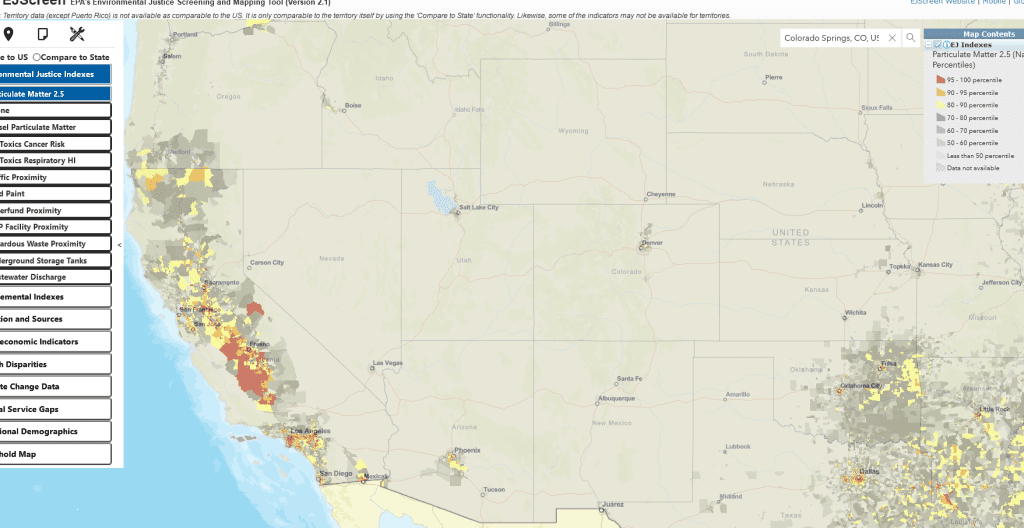
So they are saying, we mapped risks but .. they may not be accurate? It seems to me that non-ground-truthed maps can lead to a kind of bad mapping snowball, where more and more policies are based on maps which were never intended for that purpose and are.. well.. wrong for what the policy is intended to do.  We have seen that before with scientific papers in which authors use others’ data inappropriately (according to the people who collected it). Mapping also can obscure the differences between measurements and models.  Like is PM 2.5 measured or modeled? You have to look at the fine print to figure that out.

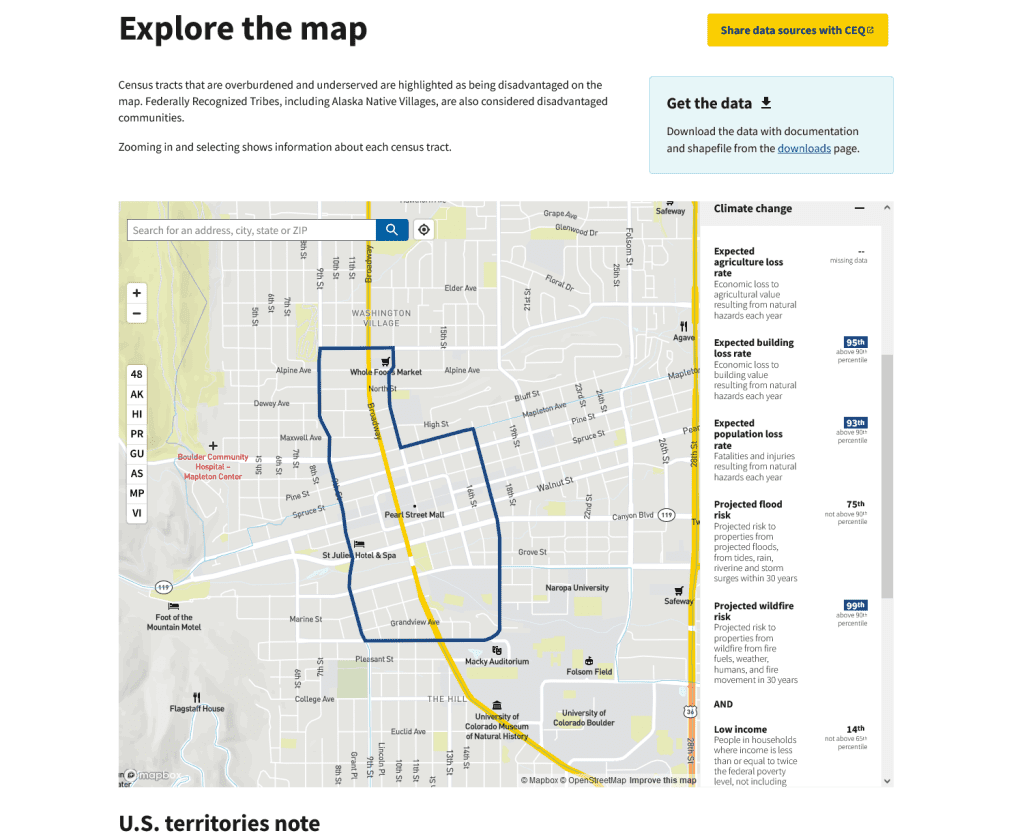
(2) But let’s go back and look at downtown Boulder. The EPA map simply says that it has a 95-100% wildfire risk in case you can’t read the numbers in the graph above.  Below is the CEQ version, which explains the numbers a little better.

So the good news is that both agencies seem to be using the same data, and based on my sample size of one, come up with the same numbers for the same area.  But let’s see what CEQ tells us that the 99 (!!!) percent number means.

Projected wildfire risk

Projected risk to properties from wildfire from fire fuels, weather, humans, and fire movement in 30 years.
Note: the next census tract east is in the 78th percentile for wildfire risk.
*****************
So let’s go back to what EPA says “they do not provide a risk assessment”, so what does that actually mean? I don’t believe that there is any probability that fire suppression folks in Boulder County will let a fire run through downtown Boulder in the next 30 years.  So is this risk as if suppression didn’t exist (because it’s hard to model, I grant you that?). Or is  it 99% of something else?
What is the argument for mapping and amplifying (what appear to be) bogus numbers? Why put risk numbers on the map if they are not appropriate for assessing risks?  I think part of this could be a language problem.


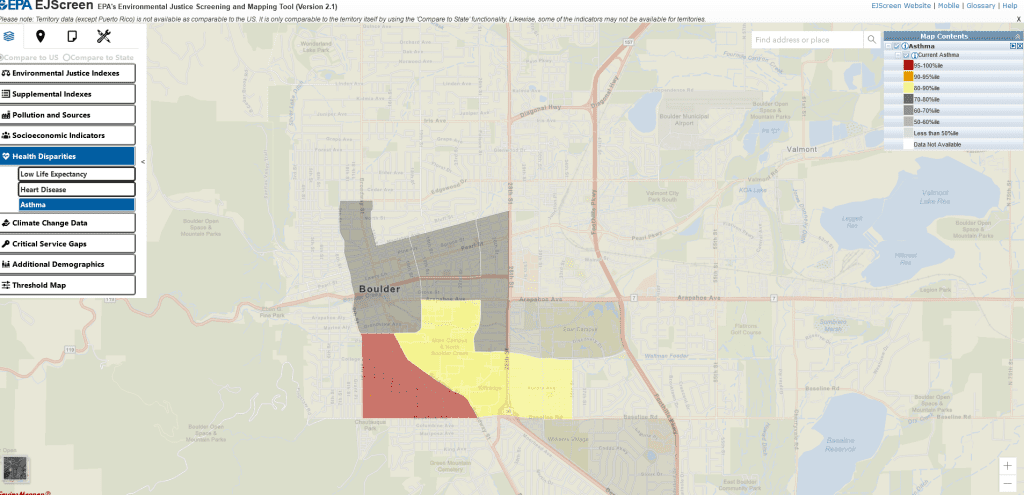
Below are some non-wildfire maps I thought were interesting. Asthma, below.

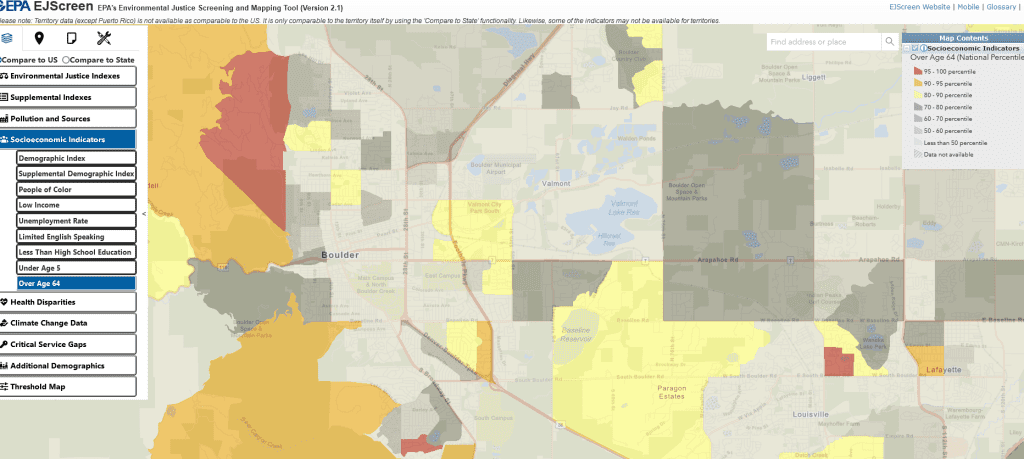
Population over age 64- red is 95-100%. So maybe that actually means 95-100% of the highest number in the US somewhere.. but if so why not use the numbers themselves? Very puzzling.


CEQ Uses First Street’s “Wildfire Risk Maps” Instead of US Government Maps in EJ Screening Tool- Why?

There are two current tools (at least) one by CEQ and one by EPA.  We’ll look at EPA’s in another post. Both of them refer to the CEJST, which is:

Federal agencies will use the CEJST for the Justice40 Initiative. It will help them identify disadvantaged communities that should benefit from the Justice40 Initiative. The Justice40 Initiative seeks to deliver 40% of the overall benefits of certain Federal investments to disadvantaged communities. These investments relate to seven areas: climate change; clean energy and energy efficiency; clean transit; affordable and sustainable housing; the remediation and reduction of legacy pollution; the development of critical clean water and wastewater infrastructure; and training and workforce development. This task of delivering the benefits of hundreds of Federal programs to disadvantaged communities is challenging. It requires fundamental and sweeping changes to the ways in which the whole Federal government operates

So that’s why it’s important to us. It will be a tool to disperse government funds, so .. should be looked at quite carefully.  There are a variety of ways to do this.  This one combines data sets collected for other purposes with intentions of “justice” so certainly deserves some scrutiny.

First, CEQ used First Street’s questionable Wildfire Risk Maps instead of the USG’s own. Why?  We’ve critiqued those maps here.

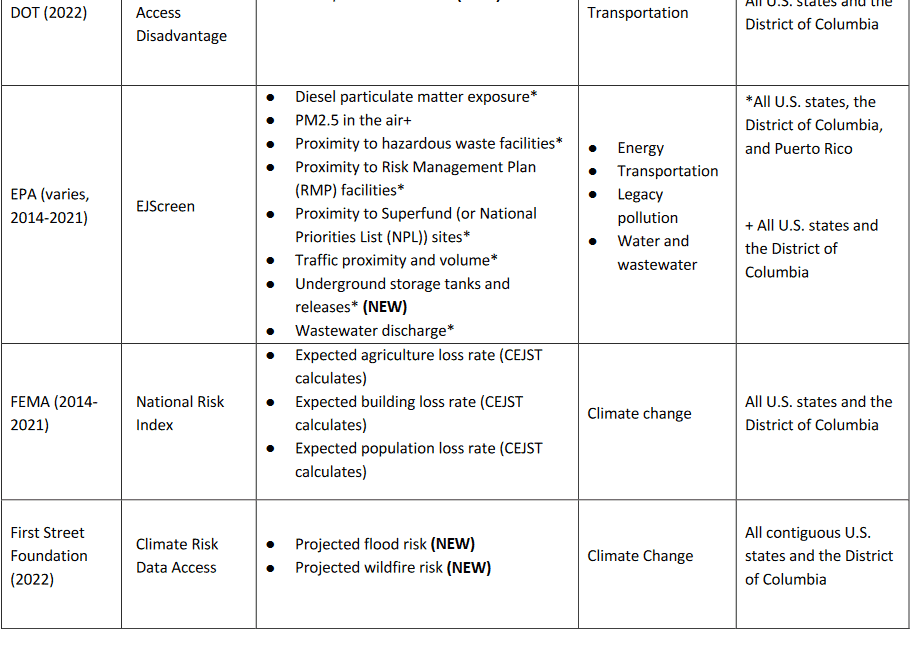
If you read their v. 1.0 technical support document, table 2 on page 18, it stands out among the other sources.    If CEQ needs wildfire risk data, wouldn’t it make more sense to ask the wildfire agencies… and if it doesn’t work for CEQ for some reason… explain why and ask the agencies to analyze that?  I think it’s really quite puzzling, given the extra transparency and quality that government data requires (e.g. the Data Quality Act).  And taking public comment and so on.

Anyway, that was a surprise!

If you think it’s a bad idea to use their data, or have other improvements to suggest,  they have a couple of places on the website to give feedback.

****************


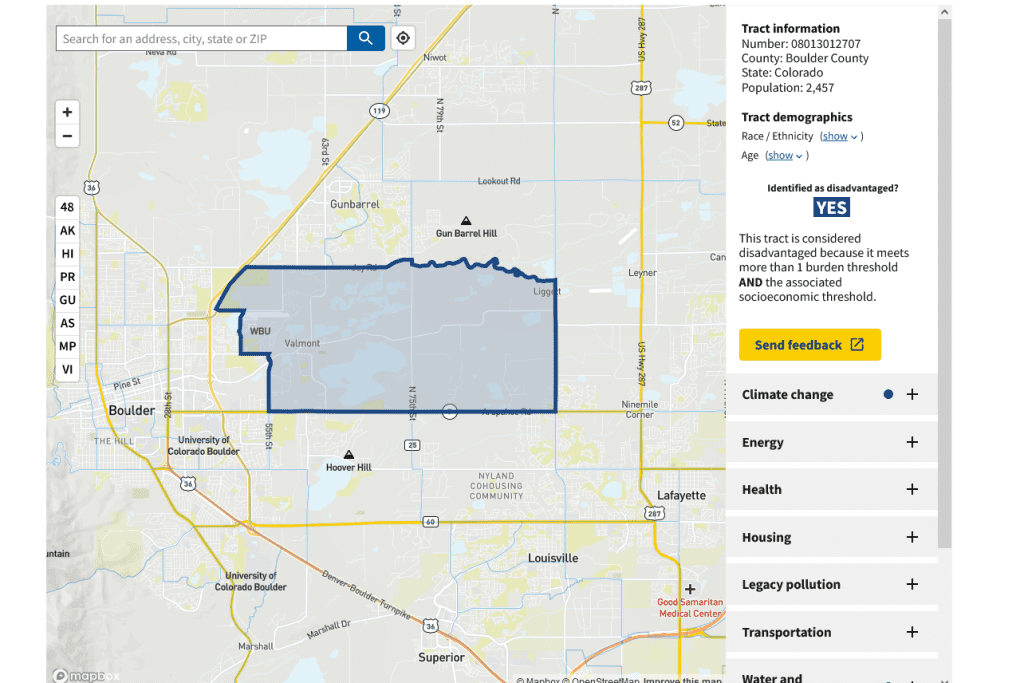
Here’s what I did.. check out some area you know. (they use census tracts so that leads to straight lines where you can imagine more of a gradient).

And then on the right side, you can check out why it is “overburdened and underserved.”

For example, I picked one next to Boulder, Colorado an area I’m familiar with.

It explains:

This tract is considered disadvantaged because it meets more than 1 burden threshold AND the associated socioeconomic threshold.

  • Expected building loss rate

    Economic loss to building value resulting from natural hazards each year 95th
    above 90th percentile
  • Expected population loss rate Fatalities and injuries resulting from natural hazards each year 96th
    above 90th

And

Low income People in households where income is less than or equal to twice the federal poverty level, not including students enrolled in higher ed
71st above 65th
I guess that must be true, but having looked at real estate in the area, I thought this was odd.

Housing cost

Share of households making less than 80% of the area median family income and spending more than 30% of income on housing 55th  not above 90th
 If that were true, they must be housing low income people there at low cost. Which would be worth investigating.

Wastewater discharge

Modeled toxic concentrations at parts of streams within 500 meters   96thabove 90th
What’s interesting is you can also look at the wastewater modelling results in the neighboring census blocks and try to detect a pattern.

Also:   High school education

                 Percent of people ages 25 years or older whose high school education is less than a high school diploma 13% above 10% percent
******************
What I’m most interested in is the “building loss rate and the expected population loss rate from natural hazards”. If we go to the next census tract west  (east of 28th street in Boulder proper) we see that the expected building loss rate is above the 90th percentile but the expected population loss rate is 86th rather than 96th.  I wonder why.
It turns out you can find out their thinking in this document.
Anyway the  building loss rate  is from FEMAs  National Risk Index and is filed under “climate change” (?).  As far as I can tell,  But when I looked around for what hazards FEMA was talking about, I could only find floods.  Which of course, First Street also models.  And sure enough, CEQ is using First Street flood models instead of FEMA’s.  So are they double-counting floods or what other hazards are being counted? I don’t think it’s earthquakes in Boulder County.

Let’s Look At: The Environmental Justice for All Act

Sorry for this long post, but it is a long and  complex bill and I only hit part of it.

There was an interesting article in E&E News about permitting reform.

“I understand, and I’ve tried to give to senators the reassurance that the transmission and grid issues — the promotion of renewable and alternative energies — have to be dealt with, but not like this,” he continued. “Taking a hatchet to [the National Environmental Policy Act] is not the way to go.”

It seems like to Grijalva, any changes to NEPA are off the table.  Which doesn’t seem rational to me (is there a human institution that couldn’t be improved in some way?).. but that’s politics.

The chair feared, he said, a scenario where leadership would offer a “trade” in which advocates would get a vote on the environmental justice bill while also having to swallow the permitting overhaul in the NDAA.

Representatives from several environmental justice groups met with staff for House Speaker Nancy Pelosi (D-Calif.) last week, and many left Capitol Hill with that same sense of foreboding, said one attendee of the meeting granted anonymity to speak candidly.

Grijalva said he has already told leadership the “EJ for All Act” should be brought to the floor under three specific parameters.

One is that only approved changes could be made to the “cumulative impacts” portion of the bill.

That title of the legislation, perhaps the most polarizing even among Democrats, would require permitting decisions under the Clean Water Act and Clean Air Act to account for the cumulative effects of harmful emissions.

So what’s in the EJ for All Act? It seems to me that it was perhaps written to deal with urban kinds of problems. The intentions are great (everyone should have equal access to healthy communities and to decision-making)I, but difficulties may well reside in the details.  I tried to interpret this through a lens of “poor and Tribal communities who do not want renewable energy development” and “poor and Tribal communities who want fuel treatment projects” and couldn’t see if those relate to this.  In the fact sheet, it says about NEPA:

National Environmental Policy Act (NEPA) – Requires federal agencies to provide early and meaningful community involvement opportunities under NEPA when proposing an action affecting an environmental justice community. Ensures robust Tribal representation throughout the NEPA process for an activity that could impact an Indian Tribe, including activities impacting off-reservation lands and sacred sites.

and

Requires consideration of cumulative impacts in permitting decisions under the Clean Water Act and the Clean Air Act and ensures that permits will not be issued if the project cannot demonstrate a reasonable certainty of no harm to human health.

This seems fairly stringent to me.. “no harm” but perhaps things like CWA and CAA do not regulate transmission lines, solar and wind facilities, and nuclear? Seems unlikely, but… Also in our area, renewable energy occurs on private lands so isn’t subject to NEPA.

A fair and just transition to a pollution4 free economy is necessary to ensure that workers 5 and communities in deindustrialized areas have ac6 cess to the resources and benefits of a sustainable
7 future. That transition must also address the eco8 nomic disparities experienced by residents living in 9 areas contaminated by pollution or environmental 10 degradation, including access to jobs, and members
11 of those communities must be fully and meaningfully 12 involved in transition planning processes.
13 (11) It is the responsibility of the Federal Gov14 ernment to seek to achieve environmental justice, 15 health equity, and climate justice for all commu 16 nities.

There’s a definition for low-income communities..

LOW-INCOME COMMUNITY.—The term 13 ‘‘low-income community’’ means any census block 14 group in which 30 percent or more of the population 15 are individuals with an annual household income 16 equal to, or less than, the greater of— 17 (A) an amount equal to 80 percent of the 18 median income of the area in which the house19 hold is located, as reported by the Department 20 of Housing and Urban Development; and
21 (B) 200 percent of the Federal poverty 22 line.

It would be interesting to see a map of these areas, and where they are close to federal lands.

Here’s a policy statement:

Potential environmental and climate threats to environmental justice communities merit a higher level of engagement, review, and consent to ensure that communities are not forced to bear disproportionate environmental and health impacts.

It seems to me that this bill is about “keeping bad things that people do from happening.” Whereas disproportionate climate impacts can be due to lack of infrastructure and resilience in EJ communities.. so pointing those kinds of projects to EJ communities might be equally important.  Certainly Congress could require this from agencies, or maybe it already does?

If some areas are to be deindustrialized, then other areas must become industrialized (where rich white people live?), or perhaps we can just get rid of industry? Most countries have an industrial policy, perhaps ours needs a deindustrial policy? What about keeping the industry production and jobs, and reducing the pollution?

What if an EJ  community supports a project, but it doesn’t pass the new legal bar of “reasonable certainty of no harm to human health?” and the project is litigated on that basis?  What does it mean to have community support? Is that evidenced via elected officials or opinion leaders or ???

In the bill, there’s a mandatory training requirement for every employee of DOE EPA DOI and NOAA, as far as I can tell not USDA. So conceivably DOI firefighters for example, but not USDA?

I’ll defer to the legal experts at TSW, but it seems to me that there are a variety of legal hooks in this bill that are likely to be used by people opposed to all kinds of projects.  And many opportunities for arguing that something is disproportionate.

Here’s what the bill says about NEPA .  It seems like agencies might do the outreach anyway, but it sounds like analysis would be added that focuses on the “ej community”?

Community input on the bill did not seem to involve disadvantaged rural people of whatever color (my bold).

2022 Community Input Tour

The unique community-led process for drafting the Environmental Justice for All Act was founded on the belief that policymaking should be led by the people most affected by the issue.

In early 2022, Chair Grijalva kicked off a nationwide Community Input Tour in environmental justice communities to talk about the bill and gather input about how it can be improved. For more information on each of the stops for the 2022 Community Input Tour, see the links below:

Community Input Tour: New York, March 11-12

Community Input Tour: Detroit, May 6-7

Community Input Tour: New Orleans, June 17-19

Community Input Tour: Southern California, July 8-10 

Community Input Tour: Richmond, Virginia, July 16 

*****************

Also it says you can provide feedback here on the bill, which I think is a great idea.. but I couldn’t figure out how.

Wouldn’t it be nice if bill language had a public comment period where you could go look up what people and groups have to say about it, and then send your own views to your elected Representative? It’s  kind of ironic to me that we probably have more public (open) discussion of 300 acre fuel treatment project than a possibly extremely expensive bill that potentially ties up decarbonization efforts in ways the authors never intended.


Let’s Ground-Truth EPA ‘s Environmental Justice Screening and Mapping Tool

Rumor has it that the Forest Service is coming out with new maps for the 10 Year Wildfire Strategy (maybe I’m missing something, but like I said it’s a rumor).  Part of it is to prioritize environmental justice, or so I heard.  So naturally, inquiring minds would want to know how this fits with the EPA EJ Screen program, which was updated in October.  Will the FS use the same maps (base data) and criteria?

 How does the EPA use this tool?

EPA uses EJScreen as a preliminary step when considering environmental justice in certain situations. The agency uses it to screen for areas that may be candidates for additional consideration, analysis or outreach as EPA develops programs, policies and activities that may affect communities. In the past, the agency employed EJ screening tools in a wide variety of circumstances.

A few examples of what EJScreen supports across the agency include:

  • Informing outreach and engagement practices
  • Implementing aspects of the following programs:
    • permitting
    • enforcement
    • compliance
    • voluntary
  • Developing retrospective reports of EPA work
  • Enhancing geographically based initiatives

EJScreen is not used by EPA staff for any of the following:

  • As a means to identify or label an area as an “EJ community”
  • To quantify specific risk values for a selected area
  • To measure cumulative impacts of multiple environmental factors
  • As the sole basis for agency decision-making or making a determination regarding the existence or absence of EJ concerns

EPA hopes to refine our uses of EJScreen as we build upon lessons learned and as we receive feedback from our stakeholders and governmental partner

The map also has “climate” risks, including wildfire risk.  If you happen to be a yellow box in the middle of orange boxes (see above) you might wonder how this fits with other wildfire risk maps.  Someone out there probably knows. But it’s always fun to ground truth these maps so take a look at your neighborhood.

Oregon Public Broadcasting has a lengthy story about the state wildfire risk mapping effort that met with public blowback. Apparently the second time around, Oregon will issue a draft and allow people to comment on it.

I wonder whether EPA did that.  It seems to me that for something as important as EJ, the public should have been involved in definitions, reviewing data and all that.  And perhaps we were, but I was not on the right mailing list.

I wonder how they considered wildfire smoke in this PM 2.5 listing?

Large Carnivore Reintroductions and Environmental Justice: Alex McInturff’s Research


Thanks to Som sai for this link of interest.. I do think that environmental justice or even plain old social justice has been somewhat overlooked with regard to many issues.   We need to think about it with regard to all the issues we face.  It seems to me that it’s like so many things in our world… there’s an abstraction.. biodiversity, climate change, environmental justice, social justice; but for some reason our thinking about them gets channelized (a thinking ditch) when if we arrayed all the choices, they would be more like a braided stream, multi-threaded and dynamic.

What unique challenges do large carnivore reintroductions pose that environmental justice can help address?

Large carnivores are a unique set of species for a lot of different reasons. They are involved in just about every kind of human-animal conflict you can imagine, so we thought they were a challenging but important place to start. Some of these challenges: People who make decisions about carnivore reintroductions sometimes don’t live near the places where the recovery efforts — and potential related animal-human conflicts — are occurring. Large carnivores themselves are wide-ranging and highly mobile. One animal’s erratic behavior can impact people’s view of the entire species. So, the challenges and the opportunities go hand in hand, and that makes this difficult, but also important, to tackle.

In the paper, you describe four components of environmental justice that are important to consider in conservation projects. Can you explain those in the context of large carnivore reintroductions? 

  • Distribution considers who is actually being harmed materially and who is benefiting
  • Participation asks who has a seat at the decision-making table
  • Recognition asks whose worldview is being recognized in the terms of the debate or in the discussion itself
  • And finally, affective (or emotional) justice considers how we appropriately account for people’s emotions — fear, anger, happiness, for example — toward the reintroduction of certain species

On this last point: On one hand, we should take emotions really seriously — fear can be life-changing and is very important to understand as a harm in and of itself. And at the same time, emotions can be difficult to estimate, and they can reorient power dynamics. In the case of large carnivores, we’ve often seen people who are not vulnerable or marginalized use emotions like fear to make themselves into victims. They wind up having an even bigger voice in the decision-making process than they might have had before.

So how can we use this environmental justice framework going forward in these reintroduction efforts?

Through a justice lens, we can ask questions about who is making decisions, and whether they are people who are in power, or people who are already marginalized. We can try to measure the ways in which material harm has been inflicted on different groups of people, or the ways in which impacts are unequally distributed. Social science, or humanistic, considerations tell us a bit about the bigger picture: What are the worldviews involved, how might those limit or enable discussions that weren’t possible before, and how are people’s emotional experiences shaping these conversations and the possible outcomes?

The reintroduction of wolves to Yellowstone National Park happened in 1995 and has been hugely divisive ever since. People have spent millions of dollars trying to address the problems that arose. But, in fact, it might be that a different kind of framing — one around justice — could offer an important new step toward addressing these problems.

This isn’t something folks love to hear, but I think the truth is, if you expect a framework like this to give you a single, perfect answer to solve problems, you’re setting yourself up for failure. Large carnivore reintroductions include a complicated and challenging set of circumstances, so having a process in place is really important, especially one that’s informed by a good understanding of justice.

What’s next with this work?

Our goal is to walk through this framework using a possible California grizzly bear reintroduction as a case study to lay out what it would actually look like to do this while thinking about environmental justice from the very beginning.

Another option would be to study the Colorado reintroduction of wolves. Certainly it started not very well from an ej (environmental justice) .. decision made by a state-wide initiative vote and won by Coloradans who don’t live in the country of reintroduction.   Arguably it would be interesting to  begin to consider ej at this point.

Why Pick Federal Lands as (the) Climate Target? Examining Potential Environmental Justice Impacts

In this March 25, 2014 photo, workers keep an eye on well heads during a hydraulic fracturing operation at an Encana Corp. oil well, near Mead, Colo. This is not federal land. (AP Photo/Brennan Linsley)

There are many ways to decrease our country’s carbon footprint.  But for some reason, it seems like federal lands oil and gas leasing has become a symbolic, if not very useful, preferred intervention of some groups (some charitable foundations).  In a recent op-ed in the Denver Post,  Jennifer Rokala of the Center for Western Priorities wrote:

President Biden’s infrastructure plan is a bold vision to move America to a clean energy future–but vision is meaningless without action.

Next month, the president will head to a global climate summit, urging world leaders to cut carbon emissions, while he simultaneously expands oil and gas drilling at home and does nothing to fix a broken leasing system. When the president encourages Congress and the world to act, he has an obligation to lead by example.

Now, as we’ve discussed previously, it seems eminently reasonable to me for the Admin to be leery of being in contempt of court with regard to the leasing process. Is it actually true to say “Biden has expanded oil and gas drilling at home?”.. or is the Admin just following rules, plans, etc. currently in place.. that legally they would need to follow specific procedures to change? So to whom is this particular climate intervention such a big issue? Easiest to get maximum climate benefits (don’t think so)? Some kind of low-hanging political fruit? Least impact to poor communities? And while we think mostly of onshore, not to forget offshore federal is also part of the deal. Some federal oil producing states (Mississippi, Louisiana, as well as onshore New Mexico) are among the poorest US states.

At the same time, this interesting article from another Jennifer, Hernandez of the Breakthrough Institute, touches on impacts of such policies on energy workers who happen to be people of color.

But unaffordable utility bills are only half the story. California climate policies also require the elimination of hundreds of thousands of conventional energy jobs, and will adversely affect millions of other jobs in energy-dependent and related industries. These sectors provide stable, higher-paying employment for less educated residents, the majority of whom are workers of color and recent immigrants. In 2019, 29 percent of all new immigrants had not graduated from high school.[42]A further 20 percent finished high school but did not attend college. As better-paying blue collar work has evaporated, most have ended up in the state’s lowest-paying jobs — that massive cohort of nearly 40 percent of Californians who cannot afford to pay routine monthly expenses.

An analysis of 2017 data by the Los Angeles County Economic Development Corporation (LAEDC) found that “across all levels of education, earnings are higher in oil and gas industries compared to the all industry average.”[43]The energy sector provides over 152,100 direct and 213,860 indirect and induced jobs in California that pay higher wages and benefits for individuals with lower levels of education. This workforce is ethnically and racially diverse, and about 63 percent of all employees have less than a bachelor’s degree.

LAEDC also showed that another 3.9 million California jobs (16.5 percent of total state employment) rely on purchases from or use products sold by state energy producers, including chemical, machinery, and metal products manufacturing, wholesale trade, utilities, and transportation, as well as professional, scientific, and technical services.[44]Most of these sectors also provide higher-paying jobs for workers of color, often in more affordable areas of the state. These jobs are also at risk from the forced elimination of the in-state energy sector.

California climate advocates have utterly failed to provide a convincing explanation for how workers of color employed in existing energy and energy-dependent sectors will support their families once these industries are gone. Many, like the fantastically wealthy, famously haughty John Kerry, now the nation’s “climate envoy,” airily suggest that green employment will replace job losses in the fossil fuel sector. Even the staunchly progressive Washington Post conceded that this was unlikely, noting that rapid growth in the wind and solar industries over the next decade could plausibly replace at most 20 percent of the workforce of the coal industry alone.[45]

Trade unions and their Democratic political allies aren’t buying what California’s climate cognoscenti are selling either. “Career opportunities for renewables are nowhere near what they are in gas and oil, and domestic energy workers highly value the safety, reliable duration and compensation of oil and gas construction jobs,” North America’s Building Trades Unions said in July 2020 after conducting two studies of the industry.[46]“We can hate on oil, but the truth is our refinery jobs are really good middle class jobs,” echoed California state senator and labor leader Lorena Gonzalez. “Jobs can’t be an afterthought to any climate change legislation. We must have specific plans that accompany industry changes.”[47]

There are no such plans. California’s oil consumption continues, slowing only with the pandemic, while progressive climate elites see no irony in forcing California’s minority communities out of jobs while importing more oil from Saudi Arabia and other countries not known for adherence to progressive labor, gender, environmental, or civil rights values.

I also ran across this article on “Civil rights readers oppose swift move off natural gas

Hernandez also has some other interesting thoughts on housing and transportation, which are related to other TSW topics of interest. I’ll take that up in another post.