Selling Natural Resources and Land to People in Other Countries

(Note: this post is more philosophical than usual. I’m interested in what people think, as I can understand both sides.)

We’ve had something before on this blog about wood exports to China. I think some people have brought up selling coal and oil and gas products, although not necessarily on this blog. I thought this piece was interesting about Chinese buying property, from a blog here by a local realtor..
I ask you, even if you disagree, not to say mean things about Jim.

Why are we doing this, and is it good policy to facilitate the purchase of American real estate by Chinese nationals?

It turns out that 85% of China’s 2.8 million high-net-worth citizens already send their children to study abroad and last year spent an estimated $50 billion buying real estate in 36 countries.

The United States is just one of many countries where the Chinese are buying real estate. A June 2013 report which I’ve posted at http://JimSmithColumns.com shows extensive buying of real estate in Europe, Asia, Australia, the Middle East, Brazil and Africa — not by businesses, but by individual Chinese wanting to invest/live outside China.

According to the China Private Wealth Report 2011, prepared by China Merchants Bank and Bain & Company, the key motivations for Chinese nationals to invest abroad are 1) children’s education, 2) getting cash out of China for security, and 3) preparation for retirement.

Chinese are not the only foreigners investing in and moving to the United States. Analyzing the list of sold homes published in last Saturday’s Denver Post, I figure that 4.5% of metro area sales are to buyers with Asian or Middle Eastern names.

But China is the only country with high-end cash buyers which severely limits online access to American real estate websites like realtor.com, Trulia and Zillow, as well as search engines like Google. That is what has driven the success of domestic Chinese websites like Juwai.com, which records 90 million searches per month within China.

Two readers sent me emails expressing the same questions and concerns which I had before signing up for this service, so I thought I would address them in this week’s column.

A reader from Morrison urged me not to “sell out” to the Chinese, who already own the Panama Canal. (I didn’t know that.) He suggested it was greed that would motivate me to advertise our listings in China….

First, there’s my responsibility to my sellers to market their home and sell it for the highest possible price. Having learned of this pool of cash buyers, could or should I refuse to show them our listings?

Secondly, these high-net-worth Chinese, themselves capitalists, are interested in the United States because they like living here in our free society.

Now, for natural resource exports, reason 2 does not apply. Do you think the landowner is “greedy” to sell outside the US, or “welcoming of strangers”? does this just apply to people in other countries, or Californians in Oregon? Why or why not?

If we have indeed extracted natural resources using our own (adequate) regulations, does it matter to whom we sell them? Is there something intuitively, or otherwise, different about selling products and selling land?

Restoration by the Numbers.. What Are They?

One more post before I leave..also if you sent me something to post and I forgot, please email [email protected] and I will get to it after my Solstice break.

___________________________________________________________________________________________________________________________________________________

If this article is correct…

Forest Service Failing to Create Jobs, Stimulate Economy in Forest Management Practices

Crystal Feldman House Natural Resources Committee

During the height of this year’s record-breaking fire season, the Subcommittee on National Parks, Forests and Public Lands held a legislative hearing on bills to address forest health and reduce the risk of catastrophic forest fire. Following a Forest Service report on the need for restoration on 65-82 million acres of National Forest land, the Forest Service testified that it had restored 3.7 million acres in 2011. Restoration is the process of assisting recovery of an ecosystem that has been degraded, damaged, or destroyed. Following the hearing, we submitted a series of questions to get further detail on what methods the agency used to “restore” these lands.

In its response, the Forest Service explained that of those 3.7 million acres, over 1.4 million – nearly 40% of the total – were “restored” through a combination of prescribed fire (fire intentionally set and monitored by the agency) and wildland-use fire (fire allowed to burn to achieve resource objectives). Meanwhile, commercial harvest was only allowed on 195,477 acres – 5% of the total work for 2011 and only .1% of the 193 million acres managed by the Forest Service.

______________________________________________________________________________________________________________________________________________________

The .1 % seems to answer one of Derek’s questions. in the People’s Database.but does it agree with the below? It would be nice to see a table that shows prescribed fire, fire use, non-commercial and commercial thinnings and mechanical treatments by acre (like how many acres were touched by different treatments in a given year). Of course, if it’s a service contract, wood might still go to mills, not sure how that is considered in the numbers either..

Like this:

x acres commercial harvest fuels reduction thinning followed by prescribed burning
y acres commercial harvest fuels reduction thinning alone
z acres prescribed burning only forest in WUI
a acres prescribed burning only grasslands and shrublands
b acres prescribed burning only forest outside WUI
c acres fuels reduction could have gone to mill but we don’t know for sure
etc.

Also A little birdie told me that some of the figures in the report below are not accurate.

http://www.nature.org/ourinitiatives/habitats/forests/newsroom/us-forest-service-program-reports-welcome-christmas-news.xml

U.S. Forest Service Program Reports Welcome Christmas News

Third Year of Collaborative Forest Landscape Restoration Program Reveals Big Benefits for People, Water, and Wildlife

http://www.nature.org/ourinitiatives/habitats/forests/newsroom/us-forest-service-program-reports-welcome-christmas-news.xml

Arlington, Virginia | December 19, 2012

An annual report was released today on the performance of a U.S. Forest Service program, called Collaborative Forest Landscape Restoration (CFLR), revealing impressive returns for forests, jobs, water, and wildlife. The three-year old program invested $40 million in forest restoration at 23 forested landscapes across the country in 2012.

As identified in the report, the 23 landscapes cumulatively provided the following 2012 results:

• Created and maintained 4,574 full- and part-time jobs;
• Generated nearly $320 million in labor income;
• Reduced the risk of megafire on 612,000 acres;
• Enhanced clean water supplies by remediating 6,000 miles of eroding roads;
• Sold 95.1 million cubic feet of timber;
• Improved 537,000 acres of wildlife habitat;
• Restored nearly 400 miles of fish habitat.

In addition to these on-the-ground results, CFLR also highlighted the opportunity to leverage matching investments in forest restoration. All told, CFLR leveraged an additional $45.4 million dollars towards collaborative actions in 2012.

Beyond the beauty they offer, forests are critical to life and livelihood across the nation. Americans forests cover one-third of the United States; store and filter half the nation’s water supply; provide jobs to more than a million wood products workers; absorb nearly 20% of U.S. carbon emissions; offer 650 million acres of recreational lands that generate well over $13 billion a year in economic activity; and provide habitat for thousands of species across the country.

Observers say the program is bucking the larger downward funding trend because restoration of National Forests is the new ‘zone of agreement’ where traditional adversaries in the timber industry, conservation, and local county governments are working to advance common goals. .

The collaborative results of the report were heralded by companies, community groups, and conservation organizations around the nation.

“The Collaborative Forest Landscape Restoration program is bringing communities from around the country together to create jobs, to restore forest and watershed health, and to reduce the costs of wildfire suppression at impressive scales,” offered Laura McCarthy of The Nature Conservancy. “The program and its many supporters are charting a successful path forward for National Forest management.”

“This is an outstanding program because it simultaneously helps forests, water, and jobs,” said Kelsey Delaney of the Society of American Foresters.

“Collaborative Forest Landscape Restoration projects are cost efficient, mostly because of their long time frame and larger scale,” added Scott Brennan of The Wilderness Society. “Selected projects are assured funding as long as appropriations are available until 2019, which provided certainty for businesses their banks and other investors, time for workers to be trained and become skilled, and for product markets to be developed and expanded.”

“Collaborative Forest Landscape Restoration has shown that the critical importance of healthy and thriving forests can be a unifying force,” said Rebecca Turner of American Forests. “Our organization is proud to be collaborating with such a diverse collective of partners on a program that received bipartisan support from Congress to improve the health of our forests, as well as creating needed jobs.”

Dylan Kruse of Sustainable Northwest said, “Collaborative Forest Landscape Restoration is about boots on the ground, creating jobs in rural communities. Now is the time to invest in rural communities and restore the health of our National Forests. CFLR does exactly that.”

CFLR is particularly valuable now, on the heels of the nation recording its third-largest wildfire year. A century of suppressing natural wildfires has resulted in unhealthy forests choked with small trees and brush that can lead to destructive megafires. Over the last 50 years the United States has had only 6 years with more than 8 million acres burned— all have occurred in the last 8 years (including 2012).

The conditions of our forests are further enflamed by pest and diseases, as well as climate change. All told, The Nature Conservancy estimates 120 million acres of America’s forests – an area bigger than the state of California – are in immediate need of restoration due to this “perfect storm” of threats.

The 23 sites to receive investment in 2012 were:
• Ozark Highlands Ecosystem Restoration, Arkansas, $959,000
• Shortleaf-Bluestem Community Project, Arkansas and Oklahoma, $342,000
• Four Forest Restoration Initiative, Arizona, $2 million
• Amador-Calaveras Consensus Group Cornerstone Project, California, $730,000
• Burney-Hat Creek Basins Project, California, $605,000
• Dinkey Landscape Restoration Project, California, $829,900
• Front Range Landscape Restoration Initiative, Colorado, $1 million
• Uncompahgre Plateau, Colorado, $446,000
• Accelerating Longleaf Pine Restoration, Florida, $1.17 million
• Kootenai Valley Resource Initiative, Idaho, $324,000
• Selway-Middle Fork Clearwater, Idaho, $1 million
• Weiser-Little Salmon Headwaters Project, Idaho, $2.45 million
• Longleaf Pine Ecosystem Restoration and Hazardous Fuels Reduction, Mississippi, $2.71 million
• Pine-Oak Woodlands Restoration Project, Missouri, $617,000
• Southwestern Crown of the Continent, Montana, $1.03 million
• Southwest Jemez Mountains, New Mexico, $392,000
• Zuni Mountain Project, New Mexico, $400,000
• Grandfather Restoration Project, North Carolina, $605,000
• Deschutes Collaborative Forest, Oregon, $500,000
• Lakeview Stewardship Project, Oregon, $3.5 million
• Southern Blues Restoration Coalition, Oregon, $2.5 million
• Northeast Washington Forest Vision 2020, Washington, $968,000
• Tapash Sustainable Forest Collaborative, Washington, $1.63 million

The CFLR annual report was produced by the CFLR Coalition, which is comprised of 145 member organizations that include private businesses, communities, counties, tribes, water suppliers, associations, and non-governmental organizations.

Copies of the 2012 CFLRP Annual Report can be requested from Jon Schwedler of the CFLR Coalition at [email protected].

Information on CFLRP can be found at the U.S. Forest Service’s website: http://www.fs.fed.us/restoration/CFLR/

Report:“National Forest Health Restoration: An Economic Assessment of Forest Restoration on Oregon’s Eastside National Forests.”

report

Thanks to Terry Seyden for this one.
In the interests of transparency, I’d like to try to establish some background information on these kinds of reports.

Who wanted it: This report was done at the behest of Governor Kitzhaber.
Who produced and funded it: “The report was assembled with funding and guidance from conservation groups, government agencies, academic institutions and business trade associations.”

Here is the link to an article about it (including a link to the document and a four page summary).

Below is an excerpt from the story.

The report looks at doubling the number of acres of east-side national forestland that undergo restoration – such as selective harvest, thinning and underbrush removal – from 129,000 annually to 250,000. Doing so, the report states, could create an additional 2,300 jobs in eastern and south central Oregon. The study says every $1 million invested in restoration generates $5.7 million in economic returns.

The work brings timber to struggling mills, provides jobs, and restores fire resiliency to the forest, the report states. Because of fire suppression, historic practices and passive management, some dry-side federal forests are choked with as many as 1,000 trees per acre, where historically about 75-100 trees per acre were typical. Some 80 percent of the 11.4 million acres of east-side forests under U.S. Forest Service management are at moderate to high risk of devastating crown fires.

The report highlights the importance of local collaboratives – in which government, industry and conservation interests work together to plan and implement restoration jobs.

“West is Best” Study and Some Review

west-best-report-map-2

Thanks to Steve Wilent for sending this study and raising some questions.

Now, for my own part, some of my best friends are economists and I am a fan of economics. Still, statistics can be used to tell many stories, and I have learned to read carefully any studies. What I like about economic work, compared to some biologists, is that economists tend to be more upfront about their assumptions. But we have to be careful, because like all research projects, they can be used to argue for policies that may be less desirable if openly discussed and debated.

My own first recollection of this was studies that showed it didn’t matter if the economy of, say, Forks, Washington, went in the dumper because the state as a whole would do fine, thanks to the entrepreneurs and other industries in Seattle. That’s kind of like saying, the family is healthy if some members are not sick but others are. The values, and spatial scale of analysis, often need to be openly discussed and questioned. So I intend to do that here.

Here is a link to the report:

Click to access West_Is_Best_Full_Report.pdf

One must be wary when one reads executive summaries, as we have shown here before. Here is a snippet of this report’s executive summary:

This report finds that the West’s popular national parks, monuments, wilderness areas and other public lands offer its growing high-tech and services industries a competitive advantage, which is a major reason why the western economy has outperformed the rest of the U.S. economy in key measures of growth—employment, population, and personal income—during the last four decades. In addition, as the West’s economy shifts toward a knowledge-based economy, new research shows that protected federal public lands support faster rates of job growth and are correlated with higher levels of per capita income.

General findings:
• Higher-wage services industries, such as high-tech and health care, are leading the West’s job growth and diversifying the economy.
• Entrepreneurs and talented workers are choosing to work where they can enjoy outdoor recreation and natural landscapes.
• Increasingly, chambers of commerce and economic development associations in every western state are using the region’s national parks, monuments, wilderness areas and other public lands as a tool to lure companies to relocate.
• High-wage services industries also are using the West’s national parks, monuments, wilderness areas and other public lands as a tool to recruit and retain innovative, high-performing talent.
Specific points:
• From 1970 to 2010, the West’s employment grew by 152 percent compared to 78 percent for the rest of the country.
• This western job growth was almost entirely in services industries such as health care, real estate, high-tech, and finance and insurance, which created 19.3 million net new jobs, many of them high-paying.
• Western non-metropolitan counties with more than 30 percent of the county’s land base in federal protected status such as national parks, monuments, wilderness, and other similar designations increased jobs by 345 percent over the last 40 years. By comparison, similar counties with no protected federal public lands increased employment by 83 percent.
• In 2010, per capita income in western non-metropolitan counties with 100,000 acres of protected public lands is on average $4,360 higher than per capita income in similar counties with no protected public lands.

So here are a couple of my points, if I were reviewing this document.

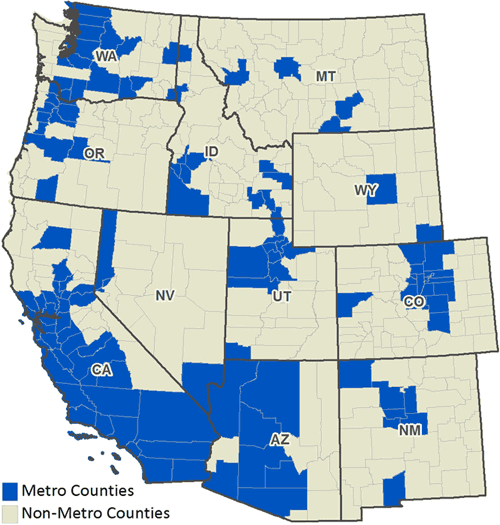
1. Is “the West” a meaningful entity from this standpoint? The map that they used is above. Wow. I don’t know how this can be meaningful. For example, in Colorado and Wyoming, at least, energy work has a great many jobs. How does this work if added with states like Oregon and Washington. Similarly, there may be jobs associated with timber in Oregon and Washington, but added to Arizona, New Mexico and Colorado, they would be a smaller percentage. My experience with Colorado Roadless taught me that states are meaningful and very different entities. If I were going to do this study, I would break down the results by state, and by rural and metro areas within the state (maybe they did but that’s not highlighted in the executive summary).

A job in Denver is not the same thing to the state or to the “West”, as a job in Monte Vista or Delta, Colorado. Which goes back to my point about the spatial scale chosen.

2. The authors argue in their paper that it’s not just “public lands” but “protected public lands,” that correlate with happy businesses willing to move to the state. (Maybe it would be better for the environment if people in rural areas had jobs, and fewer people moved to western metro areas causing pressure on public lands recreation and water 😉 ? Maybe it would be better for them to repopulate rust belt cities?).

So what, you might ask, are “protected public lands” to the authors of the report? Well, they refer to a letter signed by many economists (it sounds like Headwaters had a prominent role in the dissemination of this letter):

In 2011, more than 100 U.S. economists and related academics—including three Nobel Laureates—signed a letter urging the President to “create jobs and support businesses by investing in our public lands infrastructure and establishing new protected areas such as parks, wilderness, and monuments.” The letter states that federal protected public lands are essential to the West’s economic future, attracting innovative companies and workers, and contributing a vital component of the region’s competitive advantage.
—Economist Letter on Value of Public Lands

and

We urge you to create jobs and support businesses by investing in our public lands nfrastructure and establishing new protected areas such as parks, wilderness, and monuments.

Here’s a link to information about the letter.

Yet, I would bet that there is a high correlation between the existence of “parks, wilderness and monuments” and general public lands. To be able to prove that it was the “protected” ones and not the other (say roadless, WSAs, ski areas) etc., somehow you would have to do another analysis step. I would have thought perhaps that the National Parks lobbying organization had funded this report based on the fuzziness of the connection to the “protected causes good economies” conclusion, but I was assured by Mr. Rasker that it was funded by Headwaters itself, and he kindly sent me the link to where there funding comes from here.

If the paper is arguing that “protecting” contributes more to the economy than hunting, fishing, oil and gas, coal, skiing and OHV ing, then that would be useful, but you should approach it by county, in my view, not across “the West” .

Anyway, those are some of my thoughts on the study. What are yours?

Costs of Colorado Fire Rehab in Denver Post

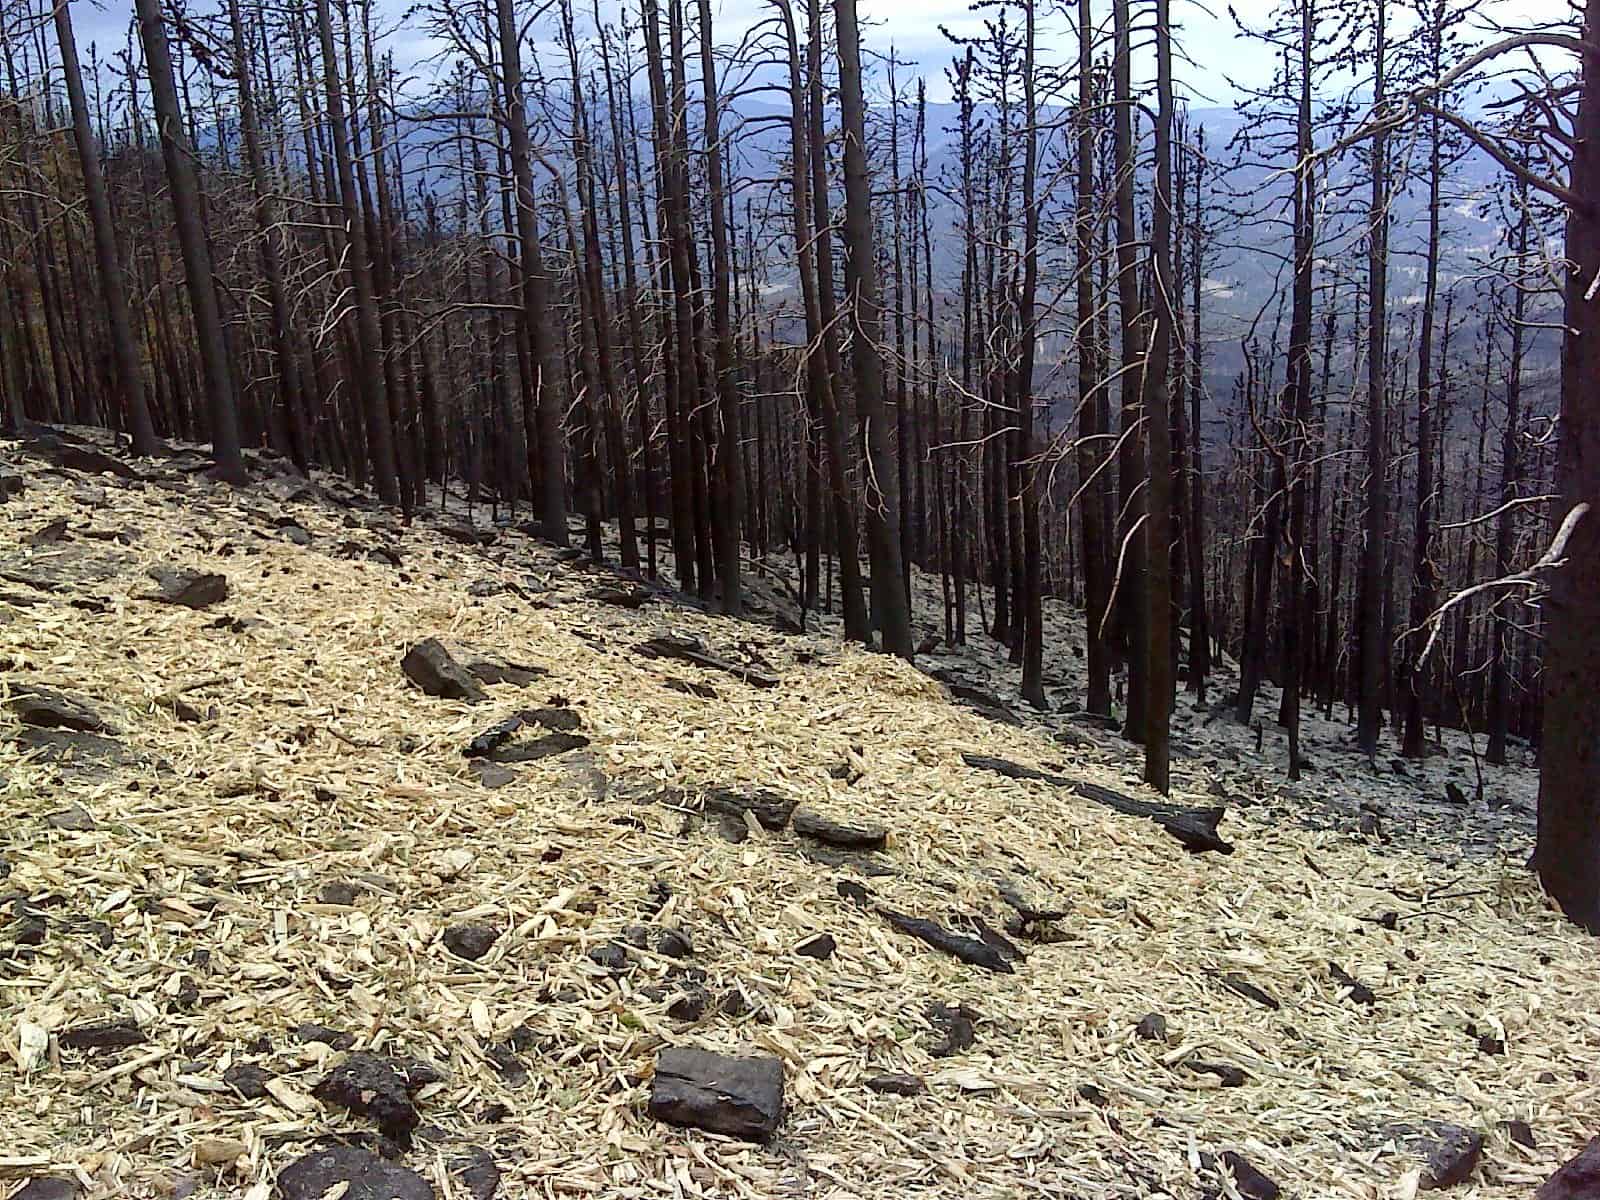
The U.S. Forest Service is using wood shreds to protect heavily burned hillsides this fall.
U.S. Forest Service

Costs of fire and fire rehabilitation/restoration, and the need to do any, has been a topic on this blog, and this was in the Denver paper this morning so I thought I’d post a link to this Denver Post story. More info and photos of mulching can be found here.

Note: I am not saying we should suppress all fires. I am not saying we should do fuel treatments everywhere. I am just pointing out some places that the funding and how much, is coming from.

A federal program to provide emergency watershed protection on Thursday poured $2.45 million into work stabilizing land burned during the devastating High Park and Waldo Canyon fires this past summer.

The Natural Resources Conservation Service in Colorado received an allocation of $1.2 million for Waldo Canyon in Colorado Springs and $1.25 million for High Park in Larimer County.

The sum is less than requested, said NRCS state conservation engineer John Andrews but will help to complete projects to stabilize soil, slow runoff and protect the watershed in areas that are considered moderately to highly burned.

In High Park, where more than 87,284 acres were burned, the money will be supplemented by about $410,000 from the cities of Fort Collins and Greeley, Larimer County, Northern Water and three small water districts known as the Tri-Districts, NRCS district conservationist Todd Boldt said.

There, the work includes reseeding and mulching, clearing debris, flood protection and efforts to keep sediment from flowing into tributaries of the Big Thompson River.

Sierra Institute’s Response to the Economic Analysis of the Critical Habitat Designation for Northern Spotted Owl

Context:

The US Fish and Wildlife Service contracted with a group called Industrial Economics out of Cambridge Massachusetts, to do the socioeconomic analysis of the designation of critical habitat for the northern spotted owl.

The Sierra Institute was commissioned by the National Forest Counties and Schools Coalition to provide third-party analysis.

Here is a link to the page that has the Sierra Institute report, the Executive Summary, and conclusions, and an excerpt from the Executive Summary.

The purpose of this report is to review and provide comments on the May 29, 2012 draft report by Industrial Economics, “Critical Habitat Designation for the Northern Spotted Owl,” prepared for the U.S. Fish and Wildlife Service.

Industrial Economics’ assessment is insufficient in its documentation of cumulative socioeconomic impacts and current socioeconomic conditions. Their interpretation of the charge of “determining whether the benefits of excluding particular areas from the designation outweigh the benefits of including those areas in the designation” is overly
narrow. As an assessment, the report does not comport with sound socioeconomic assessment science and lacks a sufficiently comprehensive evaluation of potential impacts.

While acknowledging a loss of over 30,000 jobs in the timber industry from 1990 to 2010, Industrial Economics argues that these loses were offset by regional population gains of 15% and an 18% employment increase in the decade of the 1990s. Industrial Economics errs by assuming: 1) job gains in the 1990s offset job losses in the 2000s, 2) regional population and job increases directly offset timber industry job declines, and 3) employment gains (and
losses) are equally distributed across the region. They report regional job increases of only 3% in the 2000s, and do so without analyzing impacts associated with the Great Recession, which hit hard many of counties where critical habitat areas are designated.

In discussing timber harvest impacts, Industrial Economics bases its incremental change analysis on a period in which there is a severe downturn in the economy and wood products industry. This results in an undercount of likely impacts. Estimates of harvest totals are generalized and not linked to subunit timber harvest totals, resulting in estimates that, as they acknowledge, “could vary materially from future actual timber harvest…”

Because of the shortcomings of Industrial Economics’ report as a socioeconomic assessment, the Sierra Institute for Community and Environment provides additional analysis and review of socioeconomic conditions. This is done also to improve the understanding of socioeconomic changes that have taken place since 1990 and the potential impacts of
northern spotted owl critical habitat area designation of almost 14 million acres across the California-Oregon-Washington northern spotted owl region. Designation of this amount of land as critical habitat area requires deeper and more comprehensive analysis.

and

Case studies, two in California and three each in Oregon and Washington, were conducted to better understand socioeconomic changes and current socioeconomic conditions “on the ground.” Some key findings from these cases include in California:
• Siskiyou County lost all its saw mills, has seen its population age, and has lost eight schools, challenging the county to provide for the remaining students and reverse the loss of young families.
• In Humboldt County there are powerfully suggestive relationships between mill closures and student impoverishment as reflected in Free and Reduced Price Meal (FRPM) enrollment rates. This county has suffered dramatic declines in its goodsproducing sector, with the manufacturing subsector losing 65% of its 1990 jobs by 2011.
In Oregon:
• Tillamook County has 24% of its children living in poverty, and 39% living in singleparent households, almost double the national average.
• Douglas County has 31% of its children living in poverty – twice the national average and 34% in single-parent households.
• In both of these counties, but especially in Douglas County, there are significant declines in manufacturing jobs, particularly since 2008. Free and Reduced Priced Meal participation rates increased over the last four years as well, some schools by almost 20 percent.
• Josephine County, over the last several decades saw forestry and logging jobs decline by 80%. Wages have stagnated and are two-thirds of the Oregon average. The county now ranks near the bottom of Oregon counties in health indicators and FRPM participation rate for the county is 70%.
In Washington:
• Grays Harbor County Natural Resources and Mining jobs declined by over 50% and
Forestry and logging jobs by just under 70% from 1990 to 2010. The county is near the bottom of the health rankings for counties in the state. FRPM participation rates for the county exceed 60%, with one school district at 92% in 2011 and another at 88%; the lowest rate is 41%, reflecting the considerable differences across the county.
• Skamania County has 90% of its land in federal ownership, and 59% of the land in the county is designated as critical habitat area. Natural resource and manufacturing jobs have declined by over 50% over the last 20 years, though service industry jobs have increased dramatically during this period.
* * *
Timber receipts and, more recently, the Secure Rural School and Community Self-Determination Act (SRS) payments to replace lost timber receipts to counties and schools have been historically important. In California, on average, Humboldt County Schools received just under 5% of their funding through SRS; Siskiyou received on average just
under 7%; and Trinity County received 15%. In Oregon, U.S. Forest Service SRS funding has provided on average 23% of county road budgets, with six counties receiving over 40% Response to the Economic Analysis of Critical Habitat Designation for The Northern Spotted Owl of their total road budget. Though dramatically lower in 2011, SRS payments comprised 40% or more of Skamania County general fund throughout the 2000s. In Oregon O&C counties, the Bureau of Land Management contribution to county budgets has been significant. In Douglas County in 2009 it comprised 17% of total county revenues and in Jackson County, it makes up 7% of total county revenues.
Eighteen counties received SRS O&C funding that goes directly to county general funds.
SRS is scheduled to expire in 2013. Loss of these funds will challenge already financially cash-strapped counties and school districts.
The time has long since past that we “reconcile” what Industrial Economics’ terms in its report as “competing economic and conservation goals.” Newer approaches address forestry as a “triple-bottom-line” endeavor—one in which economy, environmental, and community (or equity) benefits are all a part and integrated. This approach is not about trading off
harvests at the expense of the environment, or environmental outcomes with community and economic interests, but integrating them in ways that advance them collectively. The tenets of what Industrial Economics calls “ecological forestry” discussed in the report are suggestive, but remain too narrow as presented.

Note from Sharon: So the topic of job losses in the PNW has been discussed heatedly since I left there in the 80s. In the interest of understanding the impacts of the proposed action, it seems like this is of enough importance that I would yard up the economists in the PNW area who have worked on it to review it, and have the discussion in a public forum. The stakes are too high for any lesser form of information.

I also have to wonder why this group was chosen to do the analysis. Did more local economics groups not compete? Did they ask for too much money?

My main experience with large EIS’s (and longest!) was Colorado Roadless. I can’t imagine contracting something that size and complexity (spotted owl, across states) nto an outfit that is potentially starting from scratch. But maybe I’m missing something. I also hope the economists at the state universities were involved in reviewing.. it would be good to see the reviews and how the comments were responded to in a public venue.

More on The Price Tag for Wildfire Suppression and Recovery

This could be helpful for our discussion of costs of fires, except for the lack of dollar figures. We may have to stay tuned.

from the Denver Post here:

Colorado needs more federal help than earlier anticipated to recover from this summer’s devastating wildfires, according to a letter Gov. John Hickenlooper sent President Obama this week.

“While we are appreciative of the current declaration, as it exists today, only a select handful of local governments and private non-profits will receive (the) benefit of reimbursement and only in limited amounts,” the governor’s letter to the president states.

“Most of the identified needs remain unmet, and Colorado communities will be unable to fully recover without additional federal assistance.”

Colorado has been hit by 19 fires in 15 counties this year, Colorado’s worst season in a decade.

Obama approved aid for the state June 28.That federal money was to help local governments and non-profits recover from the 87,284-acre High Park fire in Larimer County, which claimed 259 homes and one life, and the Waldo Canyon fire in El Paso County, where flames consumed 18,247 acres and 347 homes while claiming two lives .

The president’s declaration did not come with a dollar amount, and the state’s new request does not affix a price tag for recovery.

Some Excerpts from Rand Study

Rand report here.. thought I’d excerpt some of this on topics (economic analysis of fires) we have discussed on this blog…
from pages 27-30.

Analysis
There are several important costs and resource value changes that we
did not include in our analysis because the data did not exist or because
the data or methods required to estimate the values were not yet sufficiently
well developed to justify including them. These included nonmarket
values, federal disaster assistance, timber losses, and public
health effects.

Nonmarket Values
There is a growing literature on how fires affect nonmarket resources,
such as wildlife habitats, watersheds, public health, cultural heritage,
and recreational services. But the data and methods required to quantify
these resource changes are not yet adequate to generate compelling
estimates of these nonmarket values (Abt, Prestemon, and Gebert,
2008; Hesseln and Rideout, 1999; Venn and Calkin, 2007).

Results from the small number of studies that have attempted
such valuations reveal complex effects of wildfires that may correspond
to large positive or negative value changes and to changes that
evolve dynamically over time. For instance, Englin, Holmes, and Lutz
(2008) reported complex time-varying effects from fires on recreational
demand, with demand increasing in the years immediately following a
fire but significantly decreasing in later decades.
Similarly, some fire effects result in both positive and negative
changes, such as the effects of fire on watersheds. Typically, fires
increase water yield, but they also increase sedimentation in the water.
Potts, Peterson, and Zurring (1985) attempted to value these positive
and negative outcomes, finding that the benefits of additional water
availability exceeded the costs of additional sedimentation by a factor
of more than 1,000 in some regions.

Other studies have suggested that the social value of preventing
large fires may be extremely high. For instance, using a contingent
valuation approach to estimating willingness to pay, Loomis and
Gonzales-Caban (1998) found that the societal value of protecting
the first 1,000 acres of northern spotted owl habitat in California and
Oregon amounted to $25 per household, a figure that Venn and Calkin
(2007) note is “greater than the annual national fire suppression expenditure
by the Forest Service in recent high cost firefighting years.”

The uncertainties in nonmarket values have led recent Forest Service
guidance on cost-risk analyses to suggest estimating the minimum
value of nonmarket effects that would be implied by available interventions,
rather than trying to estimate the nonmarket effects themselves
(Calkin, Hyde, et al., 2007).

Federal Disaster Assistance

In principle, federal disaster assistance funding to states, localities, and
individuals affected by wildfires should be known to the federal government.
However, a recent Congressional Research Service report on
wildfires reported that public data on Federal Emergency Management
Agency fire disaster assistance were not available (Gorte, 2006).
A portion of this funding goes to reimbursing states and local
governments for the costs they incur in suppressing wildfires. Because
we have already estimated state and local suppression costs, including
the costs of federal reimbursements in our calculations would result in
double-counting of some suppression costs. Therefore, this portion of
the federal disaster assistance budget is omitted from the analysis.
Timber Losses
While past studies have attributed considerable financial value to lost
timber (e.g., 20 percent of total losses for four large fires reviewed by
Abt, Prestemon, and Gebert, 2008), such estimates reveal widely varying
assumptions about the commercial viability of the lost timber, the
proportion of existing timber lost in burned areas, and the value of salvageable
burned timber. Some estimates of timber losses consider only
Forest Service timber lease values or lost Forest Service timber sales,
while others have considered the likely wealth transfers resulting from
the market effects of shocks to the timber supply.
Butry et al. (2001), for instance, examined the welfare effects of
the timber price reductions resulting from a short-term glut of salvaged
timber and later price increases resulting from local shortages of timber,
which they hypothesized would follow the 1998 wildfires in northeast
Florida. Their analysis suggested that short-term gains to consumers
are roughly matched by long-term gains to producers, with a net loss
resulting from the effects on owners of damaged timber.
We adopted a social cost perspective for our analyses, as opposed
to considering just the cost to the Forest Service. As such, to include
timber losses in our analysis, we would have required an estimate of the
welfare changes resulting from timber losses that are net of the types
of wealth transfers described by Butry et al. (2001). While that study
produced such an estimate for one fire in 1998, we do not believe that
these results can be generalized to timber losses nationally, and other,
more general estimates of timber resource value changes of this kind
were not available for us to incorporate into our analysis.

Public Health Effects
Fires degrade air quality in ways that are harmful and can exacerbate
asthma and bronchitis, reducing quality of life, increasing hospital
admissions, and contributing to deaths. But attributing the prevention of morbidity and mortality to fire suppression is complicated by uncertainties and great variation in the numbers of people affected by
individual fires, the severity of harms they might be expected to suffer,
and the valuation of those harms.

Sorenson et al. (1999) noted that, during the 1998 Florida wildfires,
admissions at some regional hospitals increased 91 percent for
asthma and 132 percent for bronchitis over the same period in the
prior year, though the atmospheric conditions that contributed to fire
risk in 1998 could have affected respiratory conditions as well. Butry
et al. (2001) used treatment costs as a proxy for the societal costs of
smoke from the same Florida fires, concluding that they represented
a small cost relative to other costs of the fires. Similarly, Rittmaster et
al. (2006) evaluated the health effects of a large fire in Canada. Unfortunately,
the results of each of these studies are likely unique to the fires
they investigated. We know of no analyses offering national or peracre-
burned estimates of the public health costs of smoke, so we could
not include these values in our analysis.
Next, we discuss the estimated costs of prospective aircraft. Ultimately,
it is these aircraft costs against which we compared the estimated
costs of large fires.

Will Peace Break Out in the US/Canada Softwood “Wars”?

I like peace and deals, in general, as opposed to litigation…I like the optimism of this article from the Vancouver Sun. Thanks to Craig Rawlings, Forest Business Network, for this! Note the quote below: “we’re learning to work together rather than fight over litigation.”

Here’s an excerpt:

Although there’s little doubt U.S. agitators will continue to pursue these kinds of actions, the threat to U.S. producers from Canadian lumber exports is not what it was. The recession and U.S. housing crisis altered the dynamics of the market, as both lumber production and prices fell. Canada’s share of the U.S. market dropped to barely 25 per cent — exports of softwood lumber fell from $9.6 billion in 2004 to $2.6 billion in 2009. Many analysts now expect Canada’s average market share will not return to previous levels but rather hover around 27 per cent for years to come.

As Canada’s exports of softwood lumber to the U.S. declined, so too did Canada’s dependence on the U.S. market. In 2004, 81.1 per cent of Canada’s lumber exports were destined for the U.S; by 2010, the proportion was 58.7 per cent.

What happened is that Canada — and, for the most part, we’re talking about British Columbia, which accounts for nearly 60 per cent of Canada’s lumber exports — found a voracious new market in China.

Since 2003, B.C.’s softwood lumber exports to China have risen by 1,500 per cent; and the value of exports was up 60 per cent in 2011 alone, surpassing the $1-billion mark for the first time. Lumber sales to China have grown from $900 million in 2006 to $3.2 billion in 2011, representing growth in the share of exports from 6.6 per cent to 28.8 per cent.

John Allan, president of the B.C. Lumber Trade Council, explained that China is drawn by the attributes of wood — namely seismic performance, carbon sequestration and energy efficiency, adding that B.C. producers are unlikely to abandon the Chinese market no matter what happens south of the border.

“We learned a lesson in diversifying our markets to China and ignore that lesson at our peril,” he said. “We’ll need to keep an eye on the U.S. recovery and housing starts and that will dictate where negotiations go toward a new agreement.”

Another sea-change that will affect future negotiations is the warming relationship between Canadian and U.S. producers. They have found common cause in the promotion of wood and have joined forces to market it globally. The so-called checkoff system, developed over the last three years by the Binational Softwood Council (established by the Canadian and U.S. governments under the Softwood Lumber Agreement) and overseen by the U.S. Department of Agriculture, imposes a charge on all lumber producers to fund a marketing scheme to promote the use of wood. “We’re learning how to work together versus fighting over litigation,” Allan said.

The reduced threat from exports, more diversified markets and a new spirit of cooperation will change the tenor of negotiations and their outcome.

It may even come to pass that no treaty with restrictions, quotas, tariffs and taxes will be necessary. Perhaps the risks and rewards of free trade will finally be extended to lumber, not only giving Canada access to the U.S. market but spreading the benefits of building with wood to the rest of the world.

Larimer County wildfires burned homes, buildings valued at $55 million

Here’s a link to a Denver Post story.
Below is an excerpt.

While the losses to homeowners are immediate and huge, the effect on the county’s tax base won’t be felt until 2014, Larimer County Assessor Steve Miller said.

Tax collections in 2012 were based on assessments conducted in 2010. The county will be reassessed this year to establish tax collections for 2014. In the meantime, tax bills for 2013 will reflect the fact that homes and adjacent structures burned.

“Say a home was there for five months and gone for the other seven,” Miller said, “we’ll prorate that amount.”

The recovery of lost tax collections will be slow, even if people do decide to return to the burn zone, Miller said.

Unlike the Waldo Canyon fire, which was concentrated in a Colorado Springs neighborhood, rural areas rebuild slowly. He cited the 2002 Hayman fire, which charred 137,760 acres in the mountains southwest of Denver and burned 132 homes.

“A lot of (the Hayman fire) area has still not come back to what it was beforehand, and that was what, 10 years now?” he said.

Another factor that influences how quickly an area recovers economically from a fire is what kind of structures were lost. The Waldo Canyon fire, which ripped through 347 homes in the Mountain Shadows neighborhood, occurred in an area with higher real estate values than rural Larimer County. The value of those lost homes is estimated at $110 million.

“What burned here was some vacant land and some residential,” Miller said. “The Waldo Canyon fire, that burned up some very expensive real estate, whereas we had more moderate and older structures.”