 Bill Gabbert of Wildfire Today has an interesting post on a new Wildfire Risk map. Some commenters were not too impressed based on their ground-truthing. Wouldn’t it be wise to “ground-truth before touting the accuracy of maps” rather than putting them out and telling everyone they’re correct? Is that way crazy? So Wildfire Today did some testing and so did the commenters. The results were generally not good.
It seems like modelers are driving way beyond their headlights… and acting if their models are somehow.. real.. Here’s what it says.. “Past events, current risks, and future projections based on peer-reviewed research from the world’s leading flood, fire, and climate modelers.”
Who is working at First Street Foundation? Not one of the usual fire suspects. Check them out. Their model looks very impressive and incorporates many variables .. check those out here.
Here’s their argument for why they exist:
What makes First Street Foundation unique
- Custom built models to calculate property-level climate risk statistics
- Transparent, peer-reviewed methodology that’s proven against real environmental events
- Validated by millions of users every day who continuously improve the data and science
- Easy-to-understand experience that’s trusted by industry leaders
- Building details and structure characteristics are used to customize information for your specific property
Institutional real estate investors and insurers have long had access to environmental risk data from for-profit oligopolies who use non-transparent methodologies that do not advance science and which limit access to risk information for the country. Because of this, the majority of Americans have relied on sources such as the Federal Emergency Management Agency (FEMA), the United States Forest Service, and other public agencies to understand their risk. However, these agencies are not tasked with defining risk for individual properties, do not consider how environmental changes impact that risk in the near-term future, and are often unable to incorporate the latest science due to the bureaucratic and regulatory restrictions within which they operate, leaving millions of households and property owners unaware of their true risk.
There has long been an urgent need for accurate, property-level, publicly available environmental risk information in the United States based on open source, peer reviewed science. In a mission to fill that need, First Street Foundation has built a team of leading modelers, researchers, and data scientists to develop the first comprehensive, publicly available risk models in the United States. Beginning with flood and now wildfire, First Street works to correct the asymmetry of information in the market, empowering Americans to protect their most valuable asset–their home while working with industry and government entities to inform them of their risk.
It’s great that they’re not a “for-profit oligopoly” but who funds them and what are their interests? I can’t really tell based on this.. because 990 reading is not in my skill set.
My house for example, was always at risk of wildfire. Because we live in a dry climate and things.. dry out. That’s probably why my insurance company has contracted with a private structure protection outfit. When fires start (mostly due to human ignition) the key variables are 1) wind, 2) fuel (houses, grass grazed or not, trees?) 3) how fast suppression folks get there, 3) if it’s too windy for air suppression resources, 4) how much grazing reduced fuels, 5) wind (did I mention that?). So wind is a big deal.
What about wind and climate change? That appears to be a can of worms, partially because it seems like researchers are interested in questions like “will changes in wind speed affect energy from wind turbines?” And also because.. it doesn’t seem like they know. I did find a paper from 2019..by Jeong and Sushama.. “Projected Changes to Mean and Extreme Surface Wind Speeds for North America Based on Regional Climate Model Simulations.”
The IPCC [27], however, reported that projected changes to extreme wind speeds based on GCMs are more uncertain than those to mean wind speeds because of relatively fewer studies on extreme wind speeds and the difficulties in simulating these events with GCMs.
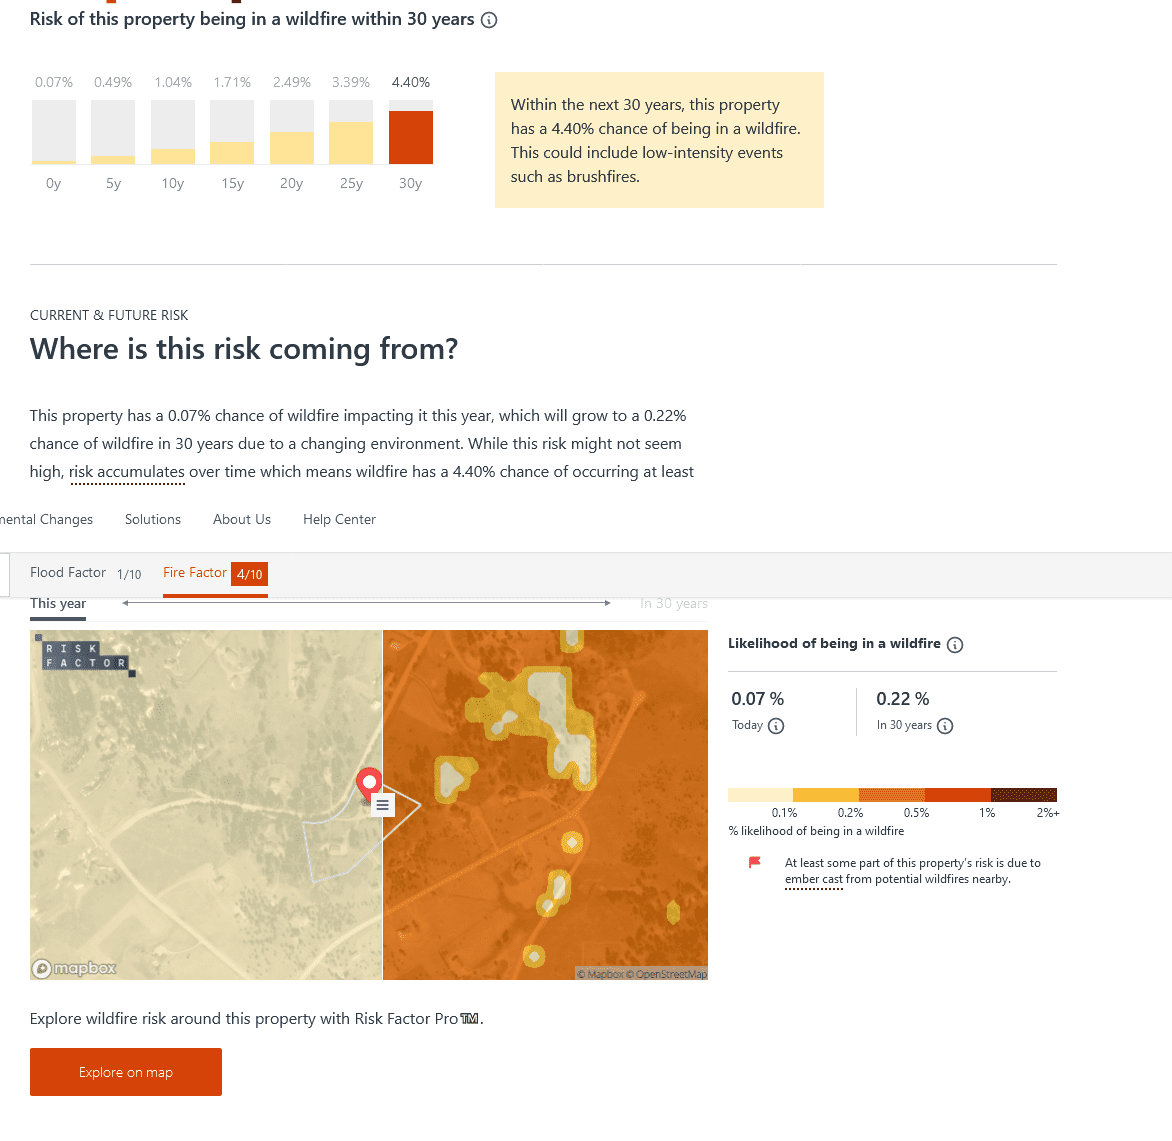
And yet, the folks at First Street Foundation tell me..that my house will go from .07 to .22 in 30 years. But they haven’t actually modelled, nor can they, the most critical factors. As they say..
Risk Factor™️ is most powerful when used in conjunction with the FEMA flood maps, WildFire.org, and other available state and local risk resources. Risk Factor should be viewed as complementary to the federally adopted risk maps for a community, which need to be used for building and permitting purposes. Risk Factor™️ allows individuals to easily view risk information at the property level, and provides useful information on potential actions to mitigate risk. More information on each community’s risk maps and mitigation plans, however, can be best obtained by contacting the community’s floodplain manager or local fire department.
The question is does is add any value to federally adopted risk maps? What does the map tell you about your house, and does it make sense?
I’m not sure what “federally adopted risk maps” you are referring to, but more information is always good. You just need to cross-check it with other information to get a feel for how good it is (as the last sentence you quoted points out). I think there is some value in something that is specific to your address and easy to use, at least as a place to start. Here’s a couple of data points.
Our house is in a developed subdivision in a north-south riparian corridor through grassy foothills at the edge of a native ponderosa pine forest, and the subdivision includes native ponderosa pine forest as well as typical landscape vegetation. There have been fires in the foothills, but the developed area seems to be pretty defensible. They rate it a “3,” “moderate” fire risk with a 2.45% probability of “being in a wildfire” in the next 30 years. Maybe that’s about right? (I wonder how the recent thinning in the adjacent forest affects their modeling?)
We have a cabin that is in an old floodplain spruce forest of essentially all native vegetation, surrounded by native conifer forest on a valley floor. It’s rated a “2,” “Minor” with “a low, but non-zero risk from wildfires over the next 30 years.” That doesn’t make much sense – if nothing else, the risk should be higher than for our house. (On the other hand, they say it has a 99% chance of flooding in the next 30 years, but FEMA doesn’t include it in its floodplain designation.)
More info is not always good if it is misleading and wrong. The burn probability map they put out is just silly. New Jersey has similar if not higher probabilities than southern California? History says that is bogus. The map while well-intentioned has some serious flaws in the science/methods used to develop it. They need to go back to the drawing board and take a mulligan on this one.
The house we left last year because of fire hazard gets a 5 out of 10, with just over an 8% chance of encountering a wildfire over 30 years. I’d say that’s a little low. The house is on an isolated ridge with tightly packed 1960s homes (~30-50 feet apart), so defensible space is dependent on everyone doing their part, which they don’t. The street is surrounded by steep undeveloped slopes covered in dense Sierra foothill pine-oak with a toyon understory. I kept after the fuels on our property really nices, and our neighbor’s fuels too, but their roofs are a mess and their rain gutters are full of leaves by August (darn black oaks drop leaves from June through November). The dominos are set to fall. Not to mention, there’s a large homeless camp about 1/2 mile away at the bottom of one of one side of the slope and 80 year old fire scars on the P pine. As they say, it’s not if, it’s when.
I don’t think it’s fair to say that the people behind this are not “the usual fire suspects”. The folks at Pyregence are real fire scientists. Their hazard modeling uses similar methods as those used by the USDA Forest Service Wildfire Risk to Communities Project. The First Street Foundation wildfire risk rating seems fair for my neighborhood in Colorado, and the general patterns they show for the Western US correspond reasonably well with where high loss WUI disasters have occurred in recent decades. Of course, they are not going to capture every nuance in their model of how building, home ignition zone, and response capability characteristics influence each home’s probability of loss.
I think for those of us who live in fire-prone areas, we have much more local knowledge of specifics, see comments above. I think the key question is “what is the audience for a national map that’s wronger than our own local observations?” Conceivably it’s to some specific end.
The wildfire and flood risk maps are yet available in my area or the other locations I tried. “Map features coming soon.”
What is the audience?
Maybe the person in your post today who wasn’t sure she would have bought the house if she had known the fire risk. (She was not someone with “local knowledge.”)
Or the Washington Post? https://www.washingtonpost.com/climate-environment/interactive/2022/wildfire-risk-map-us/?utm_campaign=wp_post_most&utm_medium=email&utm_source=newsletter&wpisrc=nl_most&carta-url=https%3A%2F%2Fs2.washingtonpost.com%2Fcar-ln-tr%2F36da8f5%2F628271be956121755a7e61ab%2F5d3a0ebdae7e8a7c4f4664c2%2F10%2F72%2F628271be956121755a7e61ab
Jon: I think the audience is whoever signs the paychecks. In this case, taxpayers. The national scale and ZIP Code stats that went into constructing this interactive online map makes it almost useless for a homebuyer or business owner to take seriously. My best guess is that it is a zoning vehicle designed for bureaucrats to allocate funding that will be provided by the audience. Hopefully I am wrong and there is an actual practical value to this product, other than politics.
You are wrong. This is a privately funded product created to generate profits through subscriptions to a “advanced” data portal. The audience is insurance companies who are scrambling to limit losses by better understanding wildfire risk. The public user portal is a nice PR front and likely a data mining tool.
Thanks Patrick! It would be interesting to see who is actually paying for this. Most of the data is from government sources, it is then integrated into the model by a number of university academics, and the Foundation is tax-exempt. So at least partially funded by taxpayers. Not sure of PR value.
Here is the predictive model for Oregon communities that was promoted just a 15 months in advance of the 2020 Labor Day Fires. These were supposedly the top 50 risks, and was nearly 100% in error. The USFS (working with “Pyrologix”) didn’t even mention Blue River, Detroit, Vida, Otis, Rainbow, Finn Rock, Idanha, Gates, Mill City or Lyons — which were all destroyed or heavily damaged. Talent did come in at #18, though, and neighboring Phoenix at #28 (2/50 = 4%). https://www.statesmanjournal.com/story/news/2019/06/04/oregon-most-at-risk-cities-towns-threatened-wildfires/3760881002/
I was trying to explain all the different risk ratings to a landowner friend and got completely lost somewhere between the FS wildfire risk assessment and the Co State version that thy use for their grants. Could it be that more information of questionable value just clouds the issue and doesn’t help? Wouldn’t it be great if there were a team who reviewed them all and made recommendations to communities and landowners which ones to use for what? Based on actual ground-truthing?
Yup. That would be much better. This is mostly just nonsense and job security, from my perspective.