Digging deeper on the topics of yesterday, I reached out to AFRC, who generously supplied further information, plus some FS contacts.
***********
The primary source for Forest Service timber accomplishments are the PTSAR reports. You can find those here: Periodic Timber Sale Accomplishment Reports (PTSAR) (usda.gov)
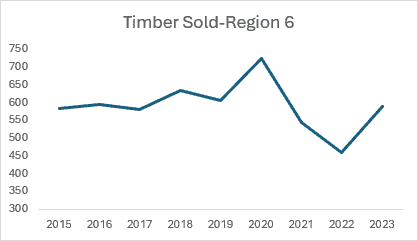
The chart below for Region 6 is based on this PTSAR data. You’ll see that the Region saw an uptick from 2022 to 2023; however, our assertions of flat/declining outputs are based on comparisons of 2023 to 2019/2020. The raw data that populated this chart is also copied below. We saw a decline by over a third from 2020 to 2022. The program remains about 18% below its 2020 levels.
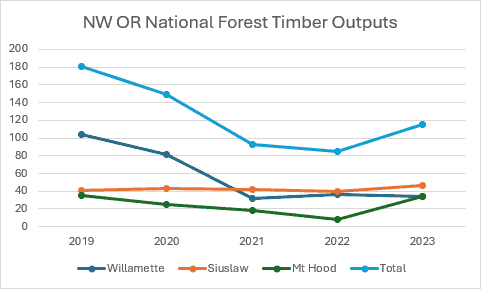
Region 6 2015 2016 2017 2018 2019 2020 2021 2022 2023 Timber Sold 585 595 581 635 607 724 545 460 589 You’re correct in that timber trends are not the same across every National Forest in Region 6. In fact, local trends are more relevant to the recent mill closures that we cite in our letter than total Region 6 trends. The mills that closed over the past few months are all located in northwest Oregon. So, the trends in western (specifically northwestern) Oregon are important to highlight. The Regional uptick in 2023 shown in the graph above has mainly been a function of growth on eastside Forests, which don’t support westside mills, which are the ones that have closed over the past few months. The graph below shows timber trends for the Mt Hood, Willamette, and Siuslaw National Forests (and totals), which were all within the purchasing circle of the closed mills. We saw nearly a 100 Million board foot drop from 2019 to 2022. Even with a slight bump in 2023, these programs are still down by over a third from 2019 levels.
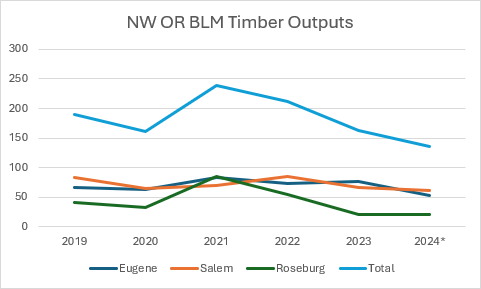
Finally, the BLM program in western Oregon cannot be ignored. The three Districts below are in the purchasing circle of the closed mills. Collectively, we’re seeing a 43% reduction from 2021 to 2024. Note that the 2024 numbers reflect the assigned targets, not actual sold volume.
BLM timber data is not as formally organized as the Forest Service. This site summarizes sold volume: Oregon Timber Sales Oregon/Washington BLM. However, the BLM has additional volume every year not accounted for in these reports. AFRC acquires that “add-on” volume directly from the Oregon State office every year.
*****************
So, we might ask, what explains these patterns? Here is what I heard from my FS sources, currently checking with BLM ones. The Siuslaw is “steady Eddy.”
The Mt. Hood and Williamette notably suffered from the 2020 wildfires. In the second chart, it looks like the Mt. Hood worked its way back to 2019 levels but the Williamette not. You might think “all those hazard trees” but that was held up by litigation, covered here at TSW, to the extent that the logs deteriorated and now the hazard trees that industry would have paid to remove, are being removed at taxpayer expense via service contracts.
There are two other issues I heard.. that timber attention ($, targets, people (not clear)) has been focused on the East Side in terms of moving things along in the Ten-Year Strategy. And a generalized inability to fill positions. I’d appreciate hearing from anyone, either via email or in the comments, who has additional ideas or experiences to add.
**************
What to make of all this? I was thinking about Seral on the Stanislaus and how they proactively did NEPA for future hazard trees. I also vaguely remember potential zones of agreement about hazard trees, even in Oregon. Perhaps the Region is doing a hazard tree NEPA decision for all forests that they could use when wildfire come along? If we believe that climate change will lead to more wildfires then wouldn’t this be proactive? Maybe the group assembled for the NWFP revision could work out the bare bones of an NWFP area hazard tree agreement in a couple of days?
As a former Supervisor of “steady Eddy” Siuslaw NF (92-99), I note that we took the big gulp circa 92 when draft NW Forest Plan came out – writing was on the wall, dropping our ASQ from 230 MMBF to 7 MMBF. This would give any boss pause, requiring a total reassessment of mgmt approach. We bit the bullet – stopped cutting big trees entirely, and moved to commercial thinning of old clearcuts, actually increasing our harvest to about 40 MMBF/yr for past 30 yrs. (Read all about it in my memoir Toward a Natural Forest; Or St Univ Press 2015). Eventually other NFs followed suit. Siuslaw has had no timber sale appeal or lawsuit for 30 years. Think about it!
Many timber purchasers dusted off their feet and fled, other brave souls retooled and partnered in the transition. I watched as PNW Region struggled to meet its 1 billion BF “obligation”, blunted by wildlife and fish constraints, and public loathing of CCing MOG in matrix lands – quite predictable
effects. Meanwhile timber industry in western OR continued to modernize most big mills, increasing production capacity every time. The squeeze on a limited federal timber supply played out brutally.
I mention in passing that selecting 2020 (end of timber-hungry Trump era) as a base of comparison doesn’t pass the sniff test. Look at trend from 2015 forward… R-6 just getting “back to normal” at about 550-600 mmbf with, yes, a shift to the east due to more urgency there and cannibalizing of mills in the west.
Jim, the Siuslaw and the Hood and the Williamette are different forests with different pressures as you know. This is Bob Zybach territory, and I don’t know how often the Siuslaw burns. I’m sure you don’t mean to be unsympathetic to the Forest that had very large wildfires.
I know you’re not a fan of Trump, neither am I, but I don’t know how much one administration can do in terms of increasing timber volumes in four years, given project planning and contracting timeframes?
Gosh Sharon, “Bob Zybach territory”? Really? I never considered laying claim!
The Siuslaw seldom burns; little lightning next to Pacific. But when it does – as it did mid-1850s – ooh mama! But it restored itself, beautifully, to become what it is today. And I AM sympathetic to NFs with big fires, BUT… (why can’t I paste in image of Lookout Fire severity map here??) a quick look at HJ Andrews Exp Forest following Lookout Fire reveals that vast majority of fire in low to moderate severity. Hardly “destroyed” – might argue that this is what fires do; change things, regenerate forests. Yes, severe areas look tough, but we need the WHOLE story told.
Can new admin make a difference in 4 years? Oh yes! Look at trend from 2016 to 2020 (not just PNW but entire US as well). I well recall John Crowell as USDA Undersecy (Reagan admin) wanted to raise NF cut from about 11 Billion bf to 20!!! Didn’t happen, fortunately. Now its about 4 billion; I can’t imagine 5x THAT!! USDA Secy Perdue famously had weekly meetings with all RFs to “review progress” on timber sales in order to jack up the volume. That pressure had notable effect – Black Hills NF led US in 2019 harvest after succumbing to such pressure with notorious overstory removals to achieve unsustainable harvests as characterized by FS Research GTR. A Dep Chief bravely offered Perdue that FS had “been down that road before; it didn’t end well” (meaning that squeezing the tube to force logging quotas is bad policy). Gone within a week.
So I look at your graph and see “2020 – present” as a return to normalcy. Thus, DON’T use 2020 as a benchmark.
Fire managers have climate change guns to their heads so it’s usually damned if you do and damned if you don’t conduct prescriptive burns. But it’s probably a straight line from the previous administration’s Secretary of Agriculture Sonny Perdue and crashes in morale within the USFS to current wildfires and conditions on the National Forest System.
I think the BIG question is “how much thinning” is needed to reduce fire risk to reasonable levels – and is thinning of MOG trees/forests essential to that objective? I don’t see the FS doing a very good job of answering this question in light of climate change and forest carbon imperatives. I think there is a way to optimize for both – in my brain’s dark recesses I seem to recall quadratic equations solving for multiple variables? I know this is not math, but both forest carbon and fire deserve better outcomes.
Where I live, the Forest Service seems to be doing a fine job answering this question. Without equations. You can also look at the Seral project. So the deeper question might be.. why is it controversial in some places and not controversial in other places?
It seems to me that places where there was a big industry influence, it’s debated, and other places not so much. Except for California.. Seral 1.0 was not litigated but a fuel break on the LP was.. hopefully some social scientists are studying this. https://amforest.org/ninth-circuit-once-again-rules-in-favor-of-tecuya-ridge-shaded-fuelbreak-project-on-los-padres-national-forest/
It seems to me as if the presence and interest of litigation-inclined groups is the difference, not FS explanations.
Is it a bad thing to have this reflect the degree of local interest? I suppose we could ask why there are “litigation-inclined groups” where they are (and whether past Forest Service actions have anything to do with that).
Yes, it’s true that not all burned areas are destroyed, Not sure what that has to do with the work that the Forest had in dealing with the aftermath of the impacts. I’m assuming that there was a lot of different kinds of work that they had to do that the Siuslaw didn’t in terms of safety, hazard trees and so on.
If I look at the table the first three years of the “timber-hungry Trump era” 2017. 2017, the first year of the Trump Admin, has less than 2016.
581 compared to 595. Indeed 635 (2018) is higher, but 607 (2019) not so much than 595. Indeed 2023 at 589 is not so different. Clearly 2020 is an anomaly but that’s one year of Trumpishness, if that’s indeed the reason about 140 above 590, but then 2022 is 130 less than 590, and we are back to 590. I’ll check further into the 2020 anomaly as well as the national numbers.
My point is not that the Trump Admin might have wanted to increase the numbers, but that there are many moving parts that have to be aligned over time to produce specific patterns.
Hazard trees are acknowledged in the NWFP and prior to the 2020 fires could be dealt with under the Road Maintenance CE. But when you have 200+ miles of road with hazard trees and removing them means a few hundred acres of what is essentially a clearcut for ~200 feet on at least one side of the road, that is where “agreement” can be difficult, primarily due to the scale of the impact. The acres that are essentially clearcut for road-related hazard trees far exceeds the acres of post-fire salvage after the fire that is not road-related.
I guess my point was…given the controversies, which seemed to be around “how to identify hazard trees” “how far from the road- what formula of slope and all the other parameters” and “what level roads”.. those seemed to be the disagreements as I recall. Yes, big fires will require big hazard tree efforts but does every one need to be renegotiated? And why is Seral 1.0 successful with a future hazard tree decision? What makes them less controversial?