Reforestation, Afforestation, Soils and Carbon

Katy Hofmeister obtains soil samples for a carbon inventory by digging a soil pit and getting specimens from various layers.

Having read a few of the “what should we do with carbon in forests” papers, and leaving aside for now the “should we use forest products” discussion, I am thinking that by looking more broadly at forests, carbon, land use change, and other environmental and social factors, we can come back to that discussion with a better sense of context for a variety of climate and carbon interventions.

I’ve found that afforestation and reforestation are on everyone’s list of what can be done that are good for carbon sequestration. Afforestation has a couple of problems. It is land use change, and in many places there are no trees due to the climatic conditions, so it wouldn’t actually work in practice. But in some areas we do have a track record of success..say in the plains states, we could have a 21st century equivalent of shelterbelts (some of the ones from the 1930’s are starting to look pretty ratty).

But back to reforestation (that is, planting trees on forested land post some form of disturbance). We know how to do it in most currently forested places, and used to do it not that long ago (1980’s). In my career, I was fortunate to be involved in the Great Region 6 Reforestation Campaign during which nurseries, infrastructure, technology improvement and so on, were all aligned toward the goal of reforestation. Even Oregon State University had the Fundamental Fir Program. Most people agree with the idea and it is not disruptive to current economic and social structures (such as converting agricultural land to forest). But here’s an angle on it I hadn’t heard before with regard to soil carbon.

Here are some quotes from this Cornell University press release:

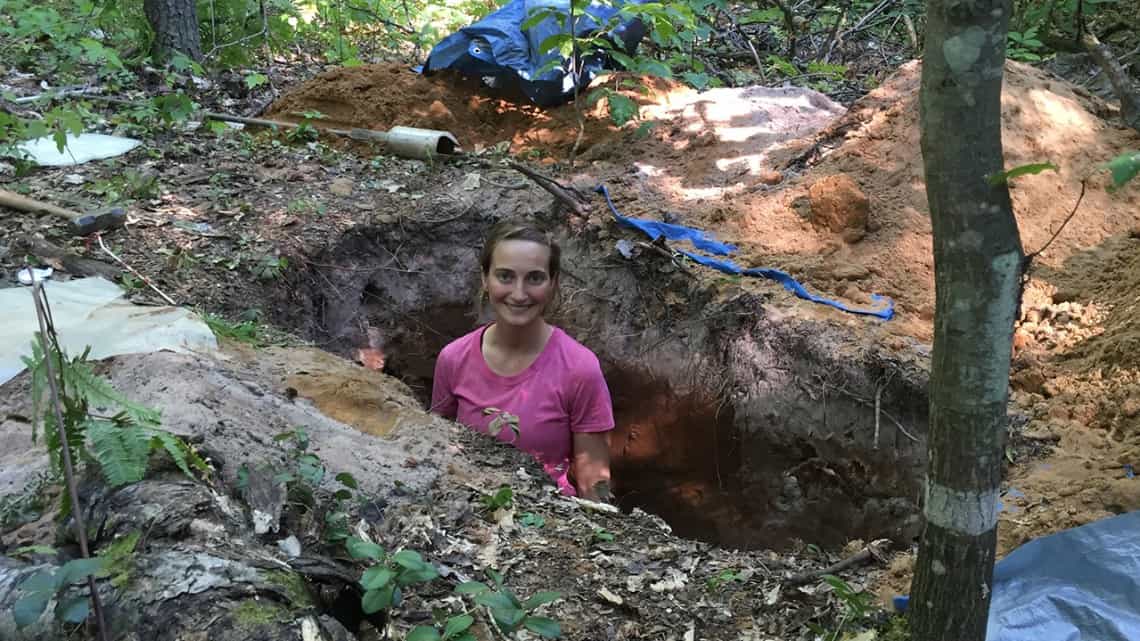
The study examined the potential to expand the soil carbon sequestration in reforested areas.

“The ability of U.S. forestlands to offset our emissions of greenhouse gases, including carbon dioxide, is decreasing,” said Hofmeister, who conducts research in natural resources and hydrology. “This is partly due to a backlog in reforestation projects on public lands that has been increasing for several decades.

“Nationwide, since 2000, less than 10 percent of forests are replanted after disturbances that eliminate forest cover. Reforestation would increase the soil carbon sink and go a long way to mitigating climate change.”

..

Sequestering carbon should be a strong component in fighting climate change, according to Hofmeister. “And, unlike other biospheric sinks, such as trees themselves – which can burn up in fires – soil carbon is quite stable,” she said.

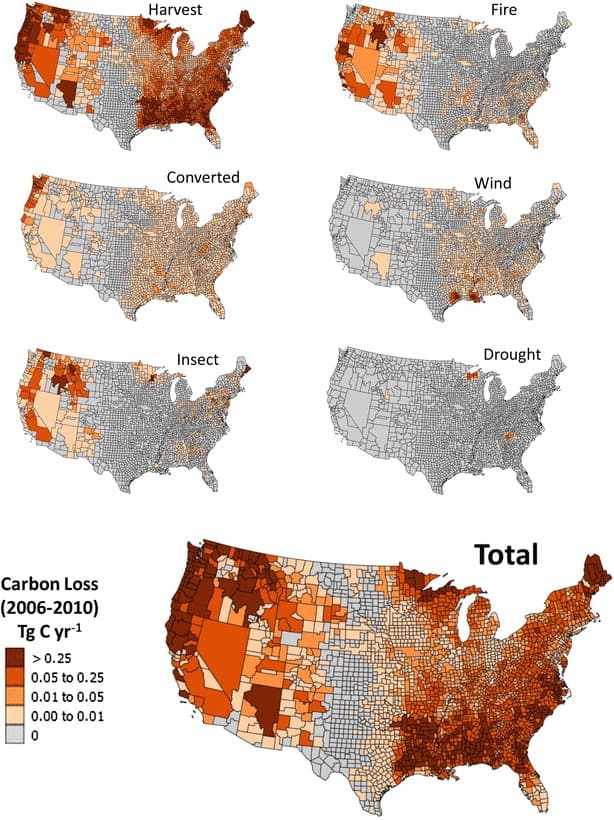
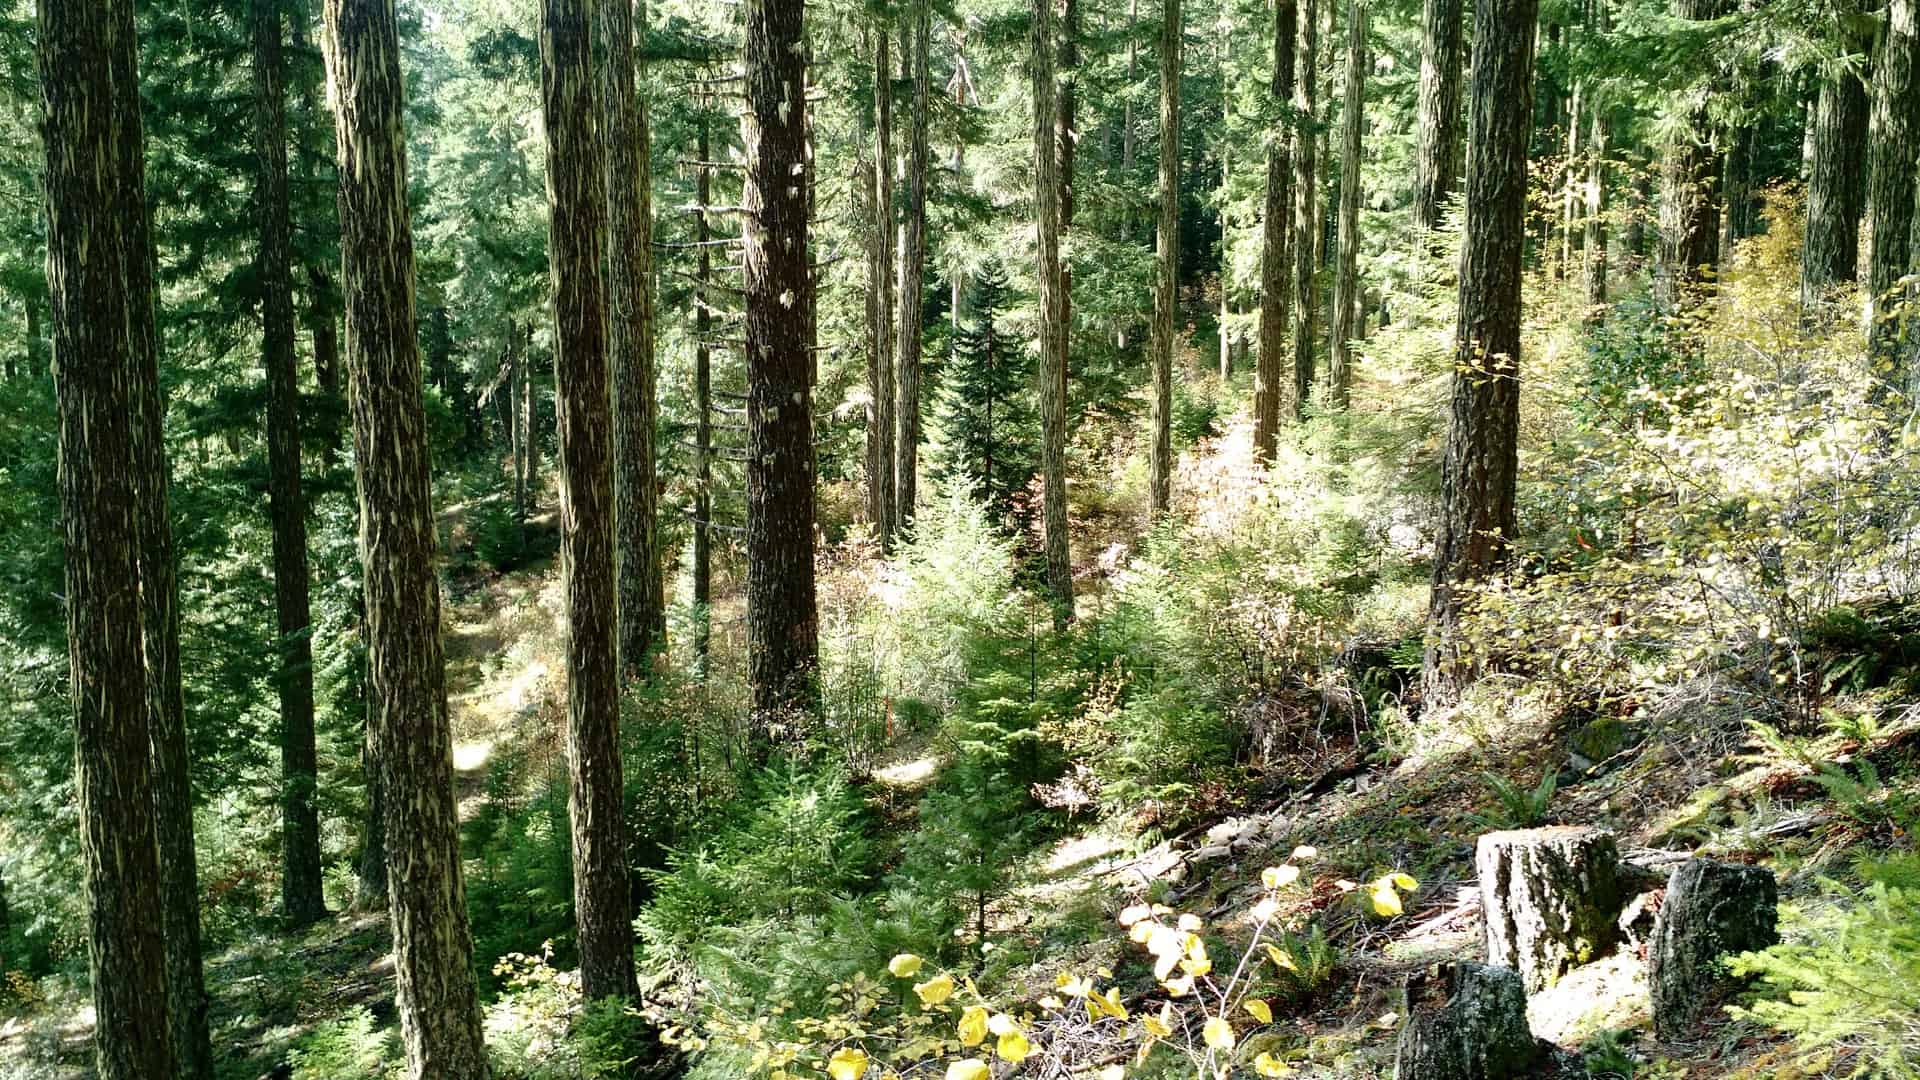
Here is a link to the PNAS paper. You’ll note that the paper is national in scope and used remote sensing. Looking out at your neighboring forest, you would be able to imagine that the numbers for increasing soil carbon locally (over what would happen without intervention) depend greatly on the soils themselves, climate and water availability, the kind of disturbance (think volcano, fire, logging) and how easily (or if) the forest would naturally regenerate. If one were to look at reforesting as a carbon investment and prioritize the areas where you would get the biggest carbon bang for the buck. Still, it’s interesting to think about.

Forest Policy Looms Over Oregon’s Climate Change Debate.. Or Does It? Oregonian Story

Steve posted this story on forest carbon in Oregon in the comments here, but I thought it was worthy of its own post.

The article says..

As lawmakers gear up to make another attempt to pass a climate change bill in 2019, new data suggests that the forest sector is not only a factor in Oregon’s carbon picture, it is THE factor and one of national and even international importance as lawmakers look to reduce the concentration of heat trapping gases in the atmosphere

I’ll come back to the italics later at the end of this post.

What is the “new data”? I wrote Ted Sickinger, the author of this article, and he said via email “I linked to the global warming commission’s draft report, which I’ve attached. But the paper linked below also addresses it. It’s also the one giving the industry conniptions.” Now I don’t know what industry he’s talking about for sure. But based on the abstract, if I were a grass grower who was asked to stop making money from grass crops, grow trees and not cut them, so that other people can claim a carbon reduction for the state, I would be a bit cranky. Unless the state were to compensate me (and the downstream folks who provide agricultural products and services) for the loss of income..

Here is the abstract of the paper his is talking about linked here:

Strategies to mitigate carbon dioxide emissions through forestry activities have been proposed, but ecosystem process-based integration of climate change, enhanced CO2, disturbance from fire, and management actions at regional scales are extremely limited. Here, we examine the relative merits of afforestation, reforestation, management changes, and harvest residue bioenergy use in the Pacific Northwest. This region represents some of the highest carbon density forests in the world, which can store carbon in trees for 800 y or more. Oregon’s net ecosystem carbon balance (NECB) was equivalent to 72% of total emissions in 2011–2015. By 2100, simulations show increased net carbon uptake with little change in wildfires. Reforestation, afforestation, lengthened harvest cycles on private lands, and restricting harvest on public lands increase NECB 56% by 2100, with the latter two actions contributing the most. Resultant cobenefits included water availability and biodiversity, primarily from increased forest area, age, and species diversity. Converting 127,000 ha of irrigated grass crops to native forests could decrease irrigation demand by 233 billion m3⋅y−1. Utilizing harvest residues for bioenergy production instead of leaving them in forests to decompose increased emissions in the short-term (50 y), reducing mitigation effectiveness. Increasing forest carbon on public lands reduced emissions compared with storage in wood products because the residence time is more than twice that of wood products. Hence, temperate forests with high carbon densities and lower vulnerability to mortality have substantial potential for reducing forest sector emissions. Our analysis framework provides a template for assessments in other temperate regions.

This study was funded by DOE and USDA-NIFA.

But this analysis reminds me of the California studies of thinning.. perhaps Oregonians could save water by doing more thinning rather than converting grass crops to trees? Was that analysis included in the study?
Here’s a link from an NSF funded study:

Forest thinning has increased in recent decades in an effort to stave off disastrous wildfires fueled by dense forests. This study shows that restoring forests through mechanical thinning or wildfire can also save California billions of gallons of water each year.

“The need for forest restoration is being driven largely by the need to lower the risk of high-intensity wildfires and restore forest health,” said University of California Merced scientist Roger Bales, director of the Southern Sierra CZO and study co-author. “Downstream users who benefit from the increased water yield are an important potential revenue stream that can help offset some of the costs of restoration.”

Forested areas needing restoration are large, Bales said, but potential changes in water availability are significant. The total effect of wildfires over a 20-year period suggests that forest thinning could increase water flow from Sierra Nevada watersheds by as much as 10 percent.

But back to the discussion draft, DISCUSSION DRAFT_OGWC Forest Carbon Project Report_v10_CLEAN_061818. I noticed that most of the references were from Harmon and Law. Which is fine, they work at OSU and OSU is the Oregon State University. But it makes me wonder whether other scientists have equally relevant ideas or points of view or research that might be relevant. If I were the State Legislature, I would have asked for a report that included a variety of different thinkers and stakeholders and scientists from all parts of Oregon, and asked “what are the environmental and social pros and cons of different approaches to forest carbon in Oregon?” That indeed might be an effort/paper worth funding.

PS After all that reading, nowhere did I find anything comparing the emissions of the timber industry to other industries, as alluded to by the first paragraph in the post “it is THE factor”. Or am I missing something?

Taking a Deeper Look at One Carbon Science Study: I. The Presentation Problem

Average annual net carbon loss (Tg C year−1) attributed to the most likely disturbance type and estimated at the combined county scale for harvest, fire, land use conversion, wind, insect, and drought. Combining these six sources results in estimates of total annual net C loss from disturbance occurring between 2006 and 2010. From Harris et al 2016.
Last December, Danna Smith said in a comment here “Across the US logging emissions are 5x emissions from fire, insects, wind and conversion (to ag/development) combined. See this 2016 study published in Carbon Management. My process of exploration of this paper started with some of our questions about Figure 3 in this paper, which I posted above.

Note: I am not criticizing any individual involved. From my first to my last questions, they were all extremely helpful to me. I hope this little story gives non-scientist a glimpse behind the curtain of the scientific paper production process.

Fortunately, the paper was published in an open access journal so we all could read it. I followed the trail to the first author and emailed her as to where she got the data for the map in question. She replied almost immediately and perhaps surprisingly, the trail went directly to a person we know, Todd Morgan at University of Montana! Small world. So I wrote him and he gave me a thoughtful answer.

A Presentation Problem
From Todd Morgan:
“One of the reasons why the harvest carbon data look so odd has to do with how they are displayed on these maps. Nevada is prime example of this, but it applies to several other areas in the west. The viewer sees huge geographic areas (e.g., the entire state of NV) shaded with a single “carbon loss” value, whereas most of the rest of the country is shaded on a county-by-county basis. Because of the way the TPO data (and possibly other FIA data) are stored in the database, and counties are often grouped together to prevent disclosure of individual landowner information, there are county groups or whole states with a single value. The paper briefly mentions this in the section “Timber product output data (TPO 2007).

A possible way to deal with this “combined county” grouping is to take that single value and divide it among the number of counties it includes. So, in NV, the value of each county in NV would be 1/17 of the state total. Or one could contact the source of the data (like you did) and find out that the NV value for harvest is really from two small counties in western NV and the statewide value could be split between those two counties and the rest of the counties assigned a Zero value. That would help make maps that visually make more intuitive sense – i.e., the brown shaded area of NV would be very small geographically relative to the rest of the state – like can be seen in east Texas vs. west Texas.

Another solution to this would have been tabular reporting of state level values for harvest (and possibly other disturbances) would allow comparisons to other whole states. At the state level, one would see that the volumes for NV (should) make sense compared to other whole states (i.e., NV would be a very small value compared to most other states). A third way to make the maps make more visual sense would be to map Tg C per acre per year – in other words scaling the data by the acres of timberland – like was done in Figure 1 of the paper. Again, that would probably reveal amounts of carbon that “make more sense” so instead of comparing the total carbon for the State of NV to each individual county in the rest of the country, one could compare the carbon per acre in NV to the carbon per acre in other locations.”

Still, something very odd seems to have been happening in Coconino, Arizona (and neighboring counties?) during this time period.

Next post: Potential Pitfalls of Combining Datasets

Exploring the Climate Science/Policy Jungle. II. What To Do About Air Travel/Tourism?

Fig. 2 | Top bilateral embodied carbon movements. In 2013, international travel caused a carbon footprint of about 1 GtCO2e, or 23% of the global carbon
footprint of tourism. Arrows point in the direction of embodied carbon flow, which—in accordance with the literature—is the direction of commodity trade,
and is opposite to the movement of people. Red arrows: bilateral international movements belonging to the top 10% of the total 1 GtCO2e. Yellow arrows:
top 10–30%. Orange arrows: 30–50%. Blue arrows: the remainder
Given that carbon is one of the major sources of climate change (landscape change and other greenhouse gases are also involved), a policy question, both nationally and internationally is “what industries get to emit CO2?” and what industries are asked via policy to reduce emissions by changing their practices and/or reducing their activity, and which are asked to stop completely (coal is an example of this).

For Each Industry
Is it an Energy Producer or User?
Via Policies, Are we asking them to: Reduce Impacts of Doing the Same Amount?
And/or Do Less?
or Stop Entirely?

In this post, we’ll take a look at international tourism, and discuss it as it relates to places and impacts in the western US. Let’s take a look at this2018 paper by Lenzen et al.(and the correction here). My point is to simply ask the question, for what industries and when, are carbon footprints a reason to change local/state/federal policies? For example, should Boulder, Colorado stop having international conferences to reduce its carbon footprint? Should Utah stop encouraging international travel to visit ski areas and National Parks?

At around 1 kgCO2e per dollar of final demand (Supplementary Table 6c), the carbon multiplier (Section ‘Input-output analysis’) of global tourism is higher than those of global manufacturing (0.8 kgCO2e per US$) and construction (0.7 kgCO2e per US$), and higher than the global average (0.75 kgCO2e per US$). Growth in tourism-related expenditure is therefore a stronger accelerator of emissions than growth in manufacturing, construction or services provision.

Conclusions
Travel is highly income-elastic and carbon-intensive. As global economic development progresses, especially among high-income countries and regions experiencing rapid economic growth, consumers’ demand for travel has grown much faster than their consumption of other products and services. Driven by the desire for exotic travel experiences and an increasing reliance on aviation and luxury amenities, affluence has turned tourism into a carbon-intensive consumption category. Global demand for tourism is outstripping the decarbonization of tourism operations, and, as a result, is accelerating global carbon emissions. At the same time, at least 15%
of global tourism-related emissions are currently under no binding reduction target as emissions of international aviation and bunker shipping are excluded from the Paris Agreement. In addition, the United States, the most significant source of tourism emissions, does not support the Agreement.

..

Recognizing the global significance of tourism-related emissions, the UNWTO proposed two mitigation strategies: (1) to encourage travellers to choose short-haul destinations with an increased use of public transportation and less aviation; and (2) to provide marketbased incentives for tourism operators to improve their energy and carbon efficiency16. Our findings provide proof that so far these mitigation strategies have yielded limited success. Neither responsible travel behaviour nor technological improvements have been able to rein in the increase of tourism’s carbon footprint. Carbon taxes or carbon trading schemes (especially for aviation services) may be required to curtail unchecked future growth in tourism-related emissions.

So, international tourism is a user of CO2 emitting energy. Emissions of international aviation are not under a binding agreement (the US is not party to the Paris Agreement, but that doesn’t matter with regard to airline emissions).

Do US/state/local policies ask the tourism industry to reduce its footprint (reduce impacts)?
Do US/state/local policies discourage international/(or long-distance air national, which may be m/l the same) tourism? In fact, current policies may well promote more tourism.

Let’s imagine some policy options. Someone at PERC, can’t remember who, suggested that National Parks charge non-citizens more for entry fees to help address maintenance backlogs. Since people are generally fairly well-off who do international travel, would this be a good policy choice? Or perhaps the extra funds could go into efforts to reduce the carbon footprint of tourism in the Parks? Or go to a research fund toward low carbon fuel for jets? Should states encourage international tourism (or from tourists who come via plane), when the results lead to greater carbon use (plus water use and potentially other more local environmental impacts)? What are the economic/environmental trade-offs and who decides? And are these impacts on anyone’s radar screen? Why or why not?

Exploring the Climate Science/Policy Jungle: I. Negative Emissions and Forests

Check out info here http://www.rffi.org/Biochar.html

I’m calling this “exploring the jungle” because I feel like I’m doing that, with a few shreds of maps that may or may not be connected.

Negative Emissions Used in Current IPCC Scenarios
Roger Pielke, Jr. does a nice job of laying out the fact that the IPCC has been using BECCS in its scenarios, the history and the policy implications in his recent paper in Issues in Science and Technology IST_33-39 Pielke.

In general, further research is necessary to characterize biomass’ long-term mitigation potential.” Yet by 2013, such caution had been left far behind, and negative emissions were central to nearly all scenarios of the IPCC Fifth Assessment Report that are compatible with a 2°C target. In less than a decade negative emissions went from an afterthought to being absolutely essential to international climate policy. No government had actually debated the merits of BECCS, there were no citizen consultations, and very little money was being devoted to research, development, or deployment of negative emissions technologies. Yet there it was at the center of international climate policy.

..

Because the proposed technologies were speculative and at best well off into the future, estimates of the costs and feasibility of their implementation could be tailored to the needs of sustaining the policy regime. Peter A. Turner and colleagues have observed that whereas “BECCS appears to be cost-effective in stylized models, its feasibility and cost at scale are not well known.” Of course not. If nothing else, full implementation of BECCS “at scale” would require the use of a global land area one and a half times the size of India (land that will therefore not be available for agriculture or other uses). In the absence of any justifiable method for predicting actual costs, why not just assume that BECCS will be affordable?

When I read this, I thought “uh-oh were we (forest people) supposed to be doing something to make this happen? Like using wood for biomass? Or planning great afforestation projects? No one told us, did they?” But I thought there had been/ is a big discussion about whether biomass was even carbon-neutral with the EPA Science Advisory Committee? Leaving that aside for now, I decided to find a list of what counted as negative emissions.

What Are Negative Emissions Technologies?

Activities commonly considered to create negative emissions include large-scale afforestation, bioenergy combined with carbon capture and storage (BECCS), direct removal of CO2 from the ambient air by means of chemical reaction, enhanced weathering, biochar formation, and soil carbon sequestration. It seems like we don’t talk much about afforestation, disagree about BECCS (with woody and non-woody plants, but either way don’t know how to scale up), with some work in biochar and soil carbon sequestration. If you’ve been watching research outputs as I have, you’ll find lots projecting what might happen under various climate change scenarios, and hardly anything about developing workable on-the-ground cost-efficient, economically viable and environmentally sensitive negative emissions technologies. But apparently others are noticing this. Fuss_2016_Research priorities for negative emissions.ERL is a paper by Fuss et al. that describes the current research gaps, and some ideas for filling them in. It even has a few paragraphs specific to forests.

How Do Negative Emissions Technologies Get Developed and Implemented?
When I asked about “how do these targets for negative emissions get implemented in the real world?” I was referred to Peters_2017_Catalysing a political shift from low to negative carbon.NCC commentary by Peters and Geden.

I’d like to thank the scientists who were kind enough to provide reprints of their papers and answer my questions. I’d like to close with three observations.
1. You don’t need to be an expert in climate to read and understand these papers and what they are saying.
2. There seems to be a disconnect between IPPC scenarios and the real world in terms of negative emissions technologies.
3. Maybe we should spend more research $ on trying to find and scale up negative emissions technologies in the real world, instead of modelling the details of unknown future events, even if some disciplines would be winners and others losers. If we looked across the broad range of government research funding, is there an optimal ratio of “trying to solve problems” versus “describing possible future problems to the fifth decimal place?” Does anyone even think about this?

Why We Disagree About Forest Carbon. II. Objectivity, Peer Review, Predictions and Funding Sources

In the quest to understand Why People Disagree About Forest Carbon (if last year summer was the Summer of Fuel Treatments, this summer can be the Summer of Forest Carbon), I’ve been thinking that this would be a great topic to explore from two angles. The first is what scientists have to say about it, and why they disagree. But what I’ve found out by exploring around the edges is that it can also be a case study in the sociology of science. Looking at what’s out there can help people understand how scientific research is produced and used in policy or management. This includes the unimaginably complicated and preternaturally vitriolic field of climate science/policy.

Fergus McLean, in a previous comment here, raised four points that can add to this discussion. First, he mentioned that Law’s paper is objective and peer-reviewed.

1. Peer review.
Without reviewing the literature on peer review in detail, I can only say here that if people think something is important, it’s not usually a volunteer activity in the sense that people aren’t paid to do it. Let’s use an analogy. We think wildland firefighting is important. We pay people to do it. We even pay them overtime and hazard pay. Doing peer review well is time-consuming and, if done well, may have hazards like falling behind in what you are being paid to do, and critical reviews, if not completely blind, have risks of irritating your colleagues. They can retaliate in a variety of unpleasant ways. People who are close enough to the topic are probably not objective (is Professor A objective when Professor C models the same phenomenon as she does, using different techniques and coming to different conclusions?). People who are far away enough to be objective usually don’t know the topic as well. We are asking for a quality product with incentives that run against the basic principles of human nature. These problems are well known in the literature, and a variety of tweaks to the process have been proposed (e.g. this Lancet paper has quite a round-up of approaches).

2. Objectivity
But don’t believe me about objectivity here’s an article in the Stanford Encyclopedia of Philosophy. Through the dense fog of academic philosophy lingo, we can see the vague outlines of observations within our own experiences.

3. Handling uncertainty
When Fergus said “Choosing to regard existing export arrangements as permanent is a political, rather than a scientific judgement, and deserving of in-depth and critical analysis.” I agree but I would tend to take a different approach. I would imagine that I had crossed disciplinary thresholds into the world of economics.
Economists have a long history of making projections about imports, exports, demand, supply, prices, and so on. Even now, I suspect there are cadres somewhere (in the US and Canada) working on today’s installment of the Softwood Lumber Agreement. One of the tools economists use is “sensitivity analysis”. When you make many assumptions about things that are unpredictable, this tool helps you figure out which ones are really meaningful to the end you are studying. Let me restate, rather than arguing about which predictions will be more accurate based on whatever criteria (after all, how good have we really been about predicting the future?), they include a range of for each unknown and it helps them understand which assumptions are more important to the outcome. I think that this is important to consider, because we rely on models so much these days, and some disciplines use sensitivity analysis much more than others.

4.How much research on carbon does forest industry fund? Does funding source matter?
“Another relevant point that can be drawn from the Atkins article is the much greater scale of resources backing research oriented to the industry point of view about forest carbon (including TreeSource itself) in contrast to Law who, since Harmon’s recent retirement, essentially works alone. “
The idea that industry backs more carbon research than NSF, the Forest Service, EPA and so on is interesting, and possible to investigate. I’m not much of an industry person but I believe there was some corporate restructuring at some point that led to them pretty much getting out of the research business. Many of my industry colleagues lost their jobs. Has that changed?

Why We Disagree About Forest Carbon. I. Atkins Article on Oregon Wild Assertions

I am extremely appreciative of David Atkins’ effort to delve into the complicated area of forest carbon in this piece at TreeSource. I actually asked several scientists if they knew of a paper that outlined the different assumptions and conclusions, and discussed the area of disagreements.. maybe someone out there knows of one? Otherwise, you have to wonder why that would not be the most important kind of paper to write..Here are the areas of disagreement, here is why, and here is what we need to do to find out more. If we are going to use science in policy, wouldn’t that be the most important kind of investigation to conduct?
It’s not the universities’ job though, here’s what Acting Dean Davis of OSU says:

“Researchers often explore extremes of a subject on purpose, to help define the edges of our understanding; or other studies might only examine one aspect of an issue which in reality does not occur in a vacuum. It is important to look at the whole array of research results around a subject rather than using those of a single study or publication as a conclusion to a field of study.”

That might be difficult for policy makers to do unassisted, and I wouldn’t blame them for throwing up their hands at what appears to be an arena of scientist gladiators.

I think it falls to government to address these policy questions, through research designed as Peter Gluckman describes here.

But how could researchers come to such wildly different conclusions on the carbon effect of wood products? This led me to a series of interviews and multiple other sources to sort through a rabbit warren of questionable assumptions and conclusions in the OSU researchers’ paper.

Make assumptions with care

Did the scientific process break down in the review – or lack of review – given this paper and its assumptions and conclusions?

The problems that surfaced in the Law paper include:

* The quote used by Oregon Wild can’t be found in the references cited.
* The calculation used to justify doubling forest rotations assumes no leakage. Leakage is a carbon accounting term referring to the potential that if you delay cutting trees in one area, others might be cut somewhere else to replace the gap in wood production, reducing the supposed carbon benefit.
* The paper underestimates the amount of wildfire in the past and chose not to model increases in the amount of fire in the future driven by climate change.
* It assumes a 50-year half-life for buildings instead of the minimum 75 years the ASTM standard calls for, which reduces the researchers’ estimate of the carbon stored in buildings.
* It assumes a decline of substitution benefits, which other LCA scientists consider as permanent.
* It models just one species of insect to account for tree mortality when there are a variety of insect and diseases which impact forest carbon capture and storage. And the insect mortality modeled was unrealistic.
* The OSU scientists assumed wood energy production is for electricity production only. However, the most common energy systems in the wood products manufacturing sector are combined heat and power (CHP) or straight heat energy production (drying lumber or heat for processing energy) where the efficiency is often two to three times as great and thus provides much larger fossil fuel offsets than the modeling allows.
* The researchers claim to conduct a Life Cycle Assessment (LCA), but fail to use the international standards for conducting such analyses, without explaining this difference in methods.
* The peer reviewers did not include an LCA expert.
* The claimed significance of substantial carbon savings from delaying harvest and the large emission numbers from the forest products sector are undermined by all of the above.

I think the pros and cons of the different assumptions might be an interesting conversation to have on this blog. And we could perhaps use this blog, if scientists were interested, as a forum for extended peer review.

Elder Care Works: Guest Post from Alan Baumann

We’ve talked about the People’s Research Priorities before on this blog, but this is the first time we’ve posted research prioritized, funded and carried out by a member of the public here. The author, Allan Baumann graduated from O.S.U. in 1979 in Forest Management. He worked with O.S.U. researchers, the F.I.R. project and then on the Umpqua NF for 31-years. He held a variety of roles in Silviculture, Fire Ecology, Timber Pre-Sale and Sale Appraisals and research. Perhaps this fits into the category of “Seniors are doin’ it for themselves” to paraphrase the Eurythmics song.

The Stand:

Lynx #1 is a 3.64 hectare (9-acre) partially-harvested stand with light-moderate entries in 1976 and 1996. It is an average Site Class Four quality stand. The stand is at about 1,000 meters elevation (3,300 feet) and is located on Panther Ridge above Steamboat, Oregon. There are three main age classes of old-growth present in the overstory: 150-175 years, 300-350 years, and 500+ years of age.

The Growth:

Similarly, the average tree weight increased from 3.13 to 4.17 Mg_Tree, while the average tree increased its diameter by 3.56” over the 40-year period. Remarkably, 89% of the 440 live-trees measured exhibited moderate-fast growth rates following both stand entries at 20-year intervals. At its current growth rate, the 440 live old-growth trees will “grow back” carbon, totaling what was removed by harvest in 1996, by the year 2020. There was 550.7 Mg_Ha of biomass measured before
harvest in 1996. The partial removal in 1996 led to a 15% reduction, or removed 84.2 Mg_Ha of biomass. In 2016, there was 538.64 Mg_Ha of biomass measured in the old-growth trees in Lynx #1; with Lynx stand #1 actively growing at 3.62 Mg_Ha per year.

Older Trees Grow Differently:

Furthermore, it is key to understand that old-growth trees seemingly grow differently than young-growth. The study measured key structural attributes like bark thickness, limb diameter, crown form and noted any visible tree pathogens like conks, fire scars, broken tops or multiple tops. Conventional young-growth thinking is that key crown structural form is important for adequate tree development; e.g. having crown ratios greater than 40% for Douglas-fir and not having a one-sided form.

In testing these hypothesis against the Lynx old-growth some interesting results were found. These might influence future forest management for improving the resilience, health and sustainability of these valued genetic-legacy trees of the forest. An in-depth look at one-sided crown trees found that while 24% did have poor growth rates, 76% had moderate or fast growth rates. Testing trees with less than 20% crown form found only 13% growing poorly, while 87% grew moderate-fast over the 40-year period. Testing trees with both poor crowns and one-sided structure, found that 23% had poor growth and 77% had moderate-fast growth rates.
Further analysis was done on trees with visible conk indicators. Fifty-one (51) trees with Phellinus pini were measured and while 26% had poor growth rates, 74% had moderate-fast growth rates. Six (6) trees with Phaeolus Schweinitzii were measured and 33% had poor growth rates and 66% were unexpectedly growing moderate-fast. Implications for this additional growth are not normally considered.

Lynx #1 white paper finala link to the entire white paper.

Here are some caveats from the author:

It is important to know that my study only followed the 471 old-growth trees in the 9-acre stand. There is a healthy intermediate layer in this all-aged stand with a 90-year cohort and now a 20-yr and 40-yr. cohort after two light partial harvests. These were not measured or factored into any carbon calculation for my paper, though it would be very interesting to sample and tabulate.

I have been asked to go back and get 50 trees as a control in an untreated area nest to this stand. I plan to do that this year and then recalculate their carbon sequestration over the same time frame given the proximal site and weather conditions.