 Last week I got wrapped up in reviewing all the fascinating discoveries about conifer adaptation that have been made in the last ten years. More on all this later- as I don’t have time to finish reviewing and emailing authors this week. So now on to something completely different.. Thanks to Forrest Fleishman for suggesting this paper, Spatially Explicit Assessment of the USDA Forest Service as a Representative Bureaucracy, as a topic of discussion. Since most of the authors are FS employees, it is fortunately open access.
Some Historical Background
Now I’ve always been a fan of increasing diversity and bringing more different kinds of people into the workplace. The FS has had notable successes at recruiting. At the same time, it could be that some groups that have traditionally been kept down economically would prefer to work in jobs with more .. I guess.. what can I call it.. cachet? Career earnings? Living in certain areas? And while targets go by percentages, it could be easier to achieve some percentages than others. Suppose you asked the question “why can’t we get more Black forestry techs in the South?” versus “why aren’t there more Asian fish bios in Region 1?”.
Questions I Have
In the paper, the authors talk about the importance of matching race and ethnicity groups (REGs) to those in a 1 hour driving distance. But that’s not what the FS tries to do (unless they have changed). It was more like “we should hire to the national labor force everywhere.” Believe me, I’ve spent time observing people trying to hire Blacks in parts of Wyoming. Not impossible, but if you have 30 people on your District, and there are 1.7% Black people in the State we are looking at small numbers- 1/30 is 3% . Maybe you could look at a Forest as a unit to get the percentages more manageable, and then maybe get the target percentages from weighting each unit by the number of employees, and use the 1 hour from that unit. How should temporaries and contractors be considered, or should they?
Note- I am not saying that the FS wouldn’t be low on certain groups no matter how you count them; what I’m trying to get at is the target should be clear to everyone who is working on getting there.
Matching local areas (note that DC is 44.2% Black, so does that mean the WO should be?) is different from diversifying all units to national percentages. Following the DC logic (you should have the national labor force percentages at HQ), you would need the regional figures, not 1 hour from the RO for Regional Offices, and 1 hour from each RD for Supervisor’s Offices?
Additionally, Riccucci and Van Ryzin state, “the social origins of a bureaucrat can produce a sense of trust and legitimacy among citizens who share those social origins, thereby resulting in
cooperation from the citizens and ultimately the production of more effective policy outcomes, without any action by the bureaucrat (in other words, without active representation)” (2017, 25).
I agree with the argument that matching like to like makes some sense for representative government. But is that true only for racial and ethnic matches? What percentage of FS employees should be, say, LDS in Utah? Could other things than race and ethnicity be considered important cultural factors to match? But would you want a Forest Supe of your own race whom you frequently disagree with or one from another race you frequently agree with? And if the Supe were “too much like” the local community, wouldn’t she tend to agree with them. And that leads back to our other discussion of what is “too much” local power over decisions on everyone’s federal land.
Here’s how the researchers did it:
First, the proportion of each race/ethnicity group within the total United States (via the ACS), at Forest Service workplaces, and the seven types of drive time polygons were visually compared. Second, for each workplace and race/ethnicity group, the proportion of employees was plotted against the corresponding proportion from the surrounding 1-hour drive time. These scatter plots per race/ethnicity group depict which workplaces have higher or lower representation, aided visually with the 45-degree line to indicate parity.
Another interesting point made was that “These workplaces across the country also serve visitors who might be coming from farther away than the 1-hour drive catchment.” The formula for precise measurement of what percentages gets way more complicated. Think ski resorts.
Some findings:
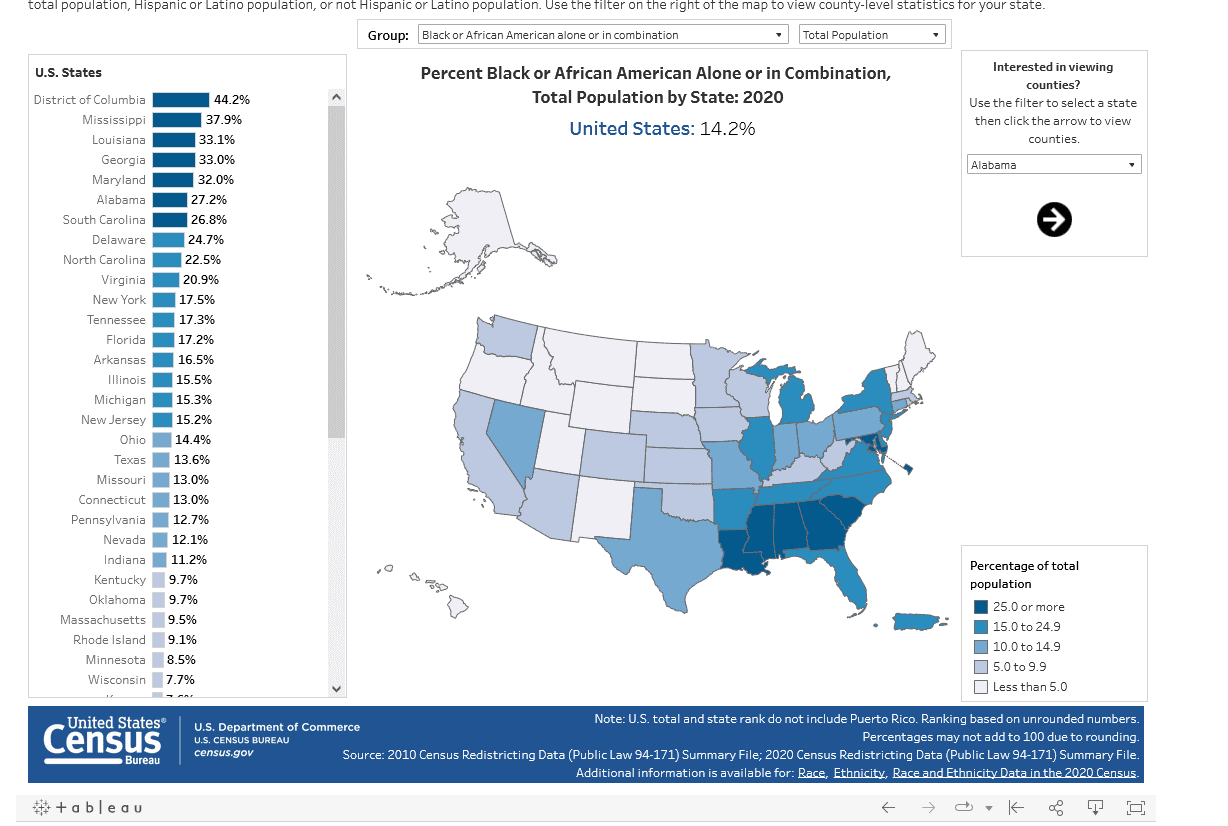
When aggregated by Forest Service region, the gap between race/ethnicity make-up of the workplaces’ surrounding communities does vary. For instance, the gap between drive time percentage of white populations and workplace representation of white employees is smallest in the Northern Region and largest in the Pacific Southwest, indicating a larger overrepresentation of white employees in the latter than the former (Figure 3). Conversely, although the percentage of people identifying as Hispanic or Latino alone is relatively high at the International Institute of Tropical Forestry (IITF) in Puerto Rico, the fraction surrounding the workplaces is higher, indicating an underrepresentation of Hispanic populations in that region’s workplace. American Indian and Alaskan Natives make up ~8% of the population around Alaskan workplaces but only ~2% of the employees. Another large gap can be found in the Southern Region, where people identifying as Black/African American alone make up ~22% of the surrounding 1-hour drive time area but only ~12% of Forest Service employees.
And I agree that more work needs to be done..
National aggregate estimates show that the Forest Service has an ~20 percentage point higher white workforce than the US population as a whole. However, the proportions of the population in a given race/ethnicity group vary across the country, making the local areas potentially a more suitable reference. When comparing each workplace with its surrounding population, that 20 percentage point gap widens to ~25 to 27 percentage points depending on the chosen drive time duration (Figure 2). Hiring locally could be one opportunity to close the gap. There are exceptions, however, as shown in Figure 4; in some workplaces, members of BIPOC groups are present in proportions greater than their surrounding drive time areas. By making data from this larger project freely available (Sachdeva et al. 2022), further inquiry is invited and encouraged. The findings are ripe for additional qualitative research in particular, and we hope the pattern-based findings can provide a platform for additional process-oriented inquiry. There is a clear need to understand why the diverse communities surrounding duty stations do not work for the Forest Service. Another opportunity for future research is in-depth examination of specific workplaces and their surrounding communities via case studies. In addition to gaining more a mechanistic understanding of what may lead to these patterns, such a close look may also provide a more precise tabulation of small rural communities’ demographic composition than the national ACS can provide.
To follow through with our previous discussion, to hire locally we would need more local people to get natural resource or other degrees. So the universities that produce these folks are inextricably linked to this, and I think should be studied as well as part of the same system. Meanwhile, demographics in communities can fluctuate on shorter timeframes than employees transferring out or retiring. I guess the key question is “should the FS match or not?” “does the USG require that, or is it additional, or at odds with matching the Civilian Labor Force?”